Diamonds or Diamonds in the Rough
Off-Campus Recruiting by Public Research Universities
Karina Salazar
University of Arizona
Ozan Jaquette
University of California, Los Angeles
Crystal Han
University of California, Los Angeles


ozanj.github.io/soc_of_ed_presentation
Motivation
Policy discourse about access to public research universities
The problem: access to public research universities
- Historical mission of social mobility for meritorious state residents
- Concern about growing socioeconomic and racial inequality in access
Mainstream policy discourse about access: The 2014 White House "Access Summit"
- The White House (2014) review of causes of unequal college access
- "achievement gap", "under-matching"; place responsibility on students, K-12 schools
- affordability; declining state support leads to rising tuition prices
- The White House (2014) asks universities for Commitments to Action on College Opportunity
- Universities pledge "action plans" (e.g., need-based financial aid, "outreach", holistic admission)
Problem with policy discourse: does not interrogate university enrollment priorities
- Applauds universities for commitment to access despite "deficiencies" of students and K-12 schools, despite declines in state funding
- Decades of research finds policy adoption a symbolic effort to appease stakeholders (e.g., Davis, 2005)
Motivation
Analyze recruiting to understand university enrollment priorities
Alternative explanation for access inequality
- University enrollment priorities biased against poor students and/or communities of color
Why study university recruiting behavior
- Universities expend substantial resources identifying and recruiting prospects (Noel-Levitz, 2018)
- Internal resource allocation better indicator of organizational priorities than rhetoric, policies
- Knowing which student populations targeted by recruiting efforts indicates enrollment priorities
Research focus
- Analyze off-campus recruiting visits (e.g., visit to a local high school) by public research universities as a means of gaining insight about university enrollment priorities
- Research question
- What are the similarities and differences in off-campus recruiting patterns across universities?
- Analytic focus
- Income; race; academic achievement; in-state vs. out-of-state
Background
The enrollment management industry
The enrollment funnel
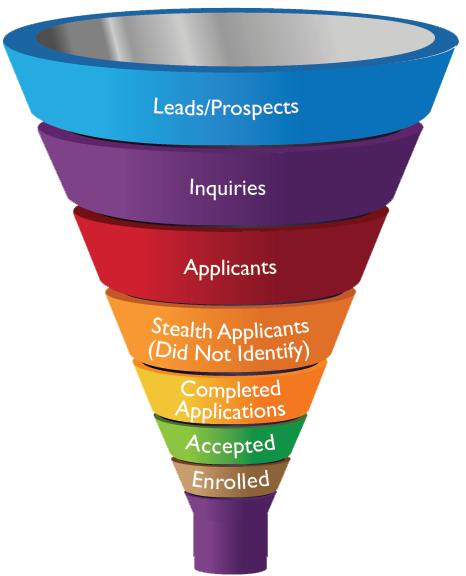
Interventions along the funnel
- Identify prospects
- Buy "student lists" from College Board/ACT
- Recruit prospects remotely
- Email, mail, text, etc.
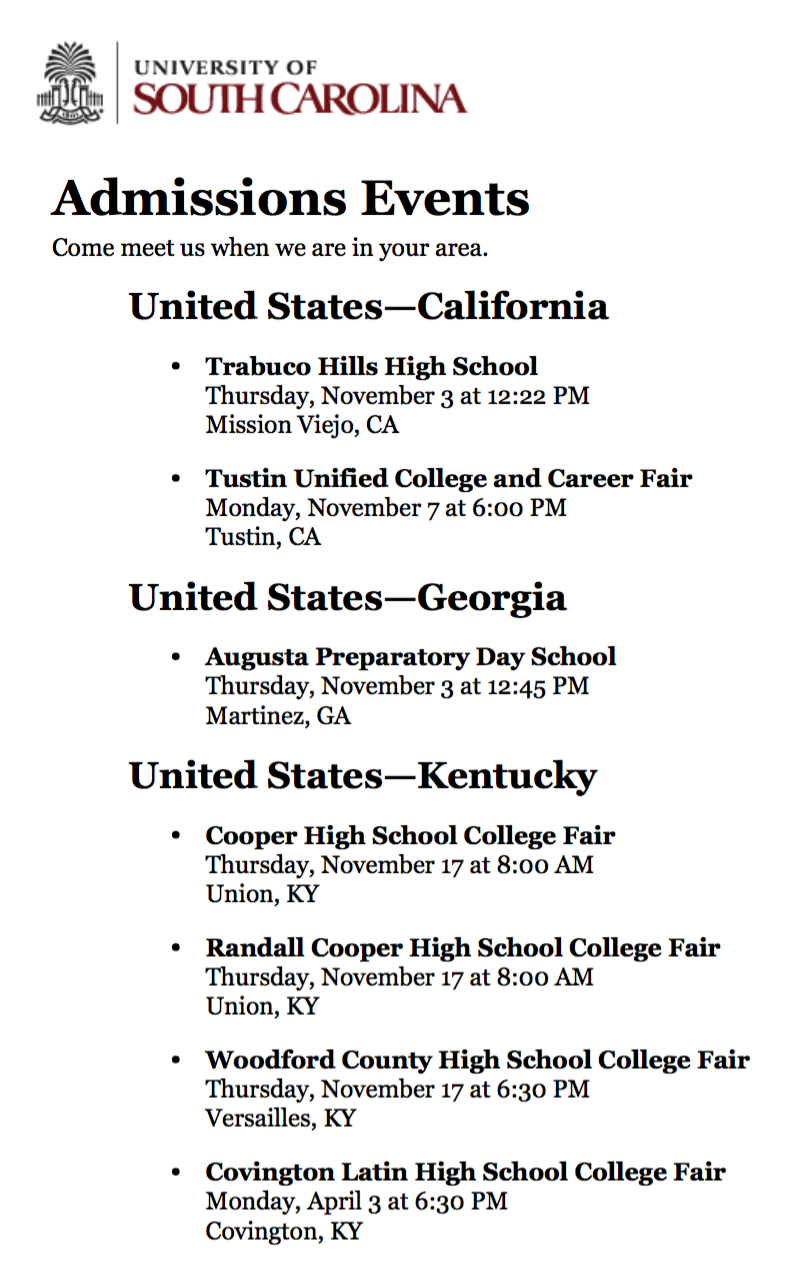
- Recruit prospects in-person
- Off-campus recruiting visits (e.g., high school visits, college fairs)
- Campus visits
- Other "outreach"
- Solicit inquiries, stealth applicants
- Social media, advertising
- Convert admits to enrollees
- Financial aid leveraging
Literature review
Scholarship on recruiting
Evaluations of recruiting/outreach interventions (e.g., Dynarski, Libassi, Michelmore, Owen, 2018)
- But unclear whether universities substantively adopt "best practices" in less controlled settings
Audits of response to "inquiries" by admissions officers (e.g., Hanson, 2017; Thornhill, forthcoming)
- Identifies biases of individual admissions officers
Off-campus recruiting visits: identify prospects, connect with proespects already targeted by mail/email
- Scholarship analyzing college perspective (Stevens, 2007)
- Important for relationships with prospects, counselors at "feeder" schools
- Market research (Noel-Levitz, 2018)
- Second highest source of "inquiries" (after student list purchases)
- Third highest source of enrollees (after stealth applicantsm on-campus visits)
- Scholarship analyzing perspective of high school students (Holland, 2019)
- Which universities visit affects student decisions; especially first-gen, students of color
Research gap: we don't know which universities visit which schools, communities
- If poor students, communities of color not receiving visits, "under-matching" may be due to under-recruiting rather than lack of guidance
Theoretical framework
Enrollment priorities and recruiting behavior
Theoretical motivation for studying recruiting
- Contingency theory (Thompson, 1967)
- Technical level: produce outputs (e.g., teachers at school, admissions officers in EM office)
- Managerial level: procure inputs; direct technical level and "buffer" from external environment
- "New" institutional theory (Meyer and Rowan, 1977)
- Publicly adopt goals demanded by environment
- Technical level cannot pursue all goals
- Substantively adopt some goals (technical level)
- Symbolically adopt others (policies, rhetoric)
"Iron triangle" of enrollment management (EM)
- Three broad enrollment goals: access, academic profile, revenue
- Scarce resources; depending on priorities, some goals receive more resources than others
- Enrollment priorities cannot be discerned by policies, rhetoric (e.g., The White House, 2014)
- Off-campus recruiting is allocation of resources from technical level
- Knowing which populations targeted by recruiting interventions indicate enrollment priorities
Theoretical framework
Expectations about similarities and differences in recruiting behavior
Resource dependence theory (Pfeffer and Salancik, 1978)
- Orgs require stable flow of resources from external environment to survive/thrive
- Sensitive to demands from providers of important resources that cannot be obtained elsewhere
- Org strategies when a resouce becomes uncertain/declines or demands become onerous
- e.g., compliance, avoidance, cooptation, resource diversification
Resources public research universities value
- financial resources (state funding, tuition, research, donations); steady flow of students; prestige, etc.
Resource diversification in response to prolonged decline in important resources
- Universities with weak state funding
- Prioritize students that generate tuition revenue
- More visits to affluent out-of-state, affluent in-state
- Universities with small/declining "college age" population
- More out-of-state visits
Research methods
The broader off-campus recruiting research project
Data collection
- Method
- Web-scrape admissions websites
- public records requests
- Criteria to be included in data collection
- Post visits on admissions websites
- Organizational type
- Data collection sample
- 54 public research universities
- 49 private research universities
- 42 selective private liberal arts
- Data collection period
- 1/1/2017 to 12/31/2017
- Ongoing data collection with larger sample
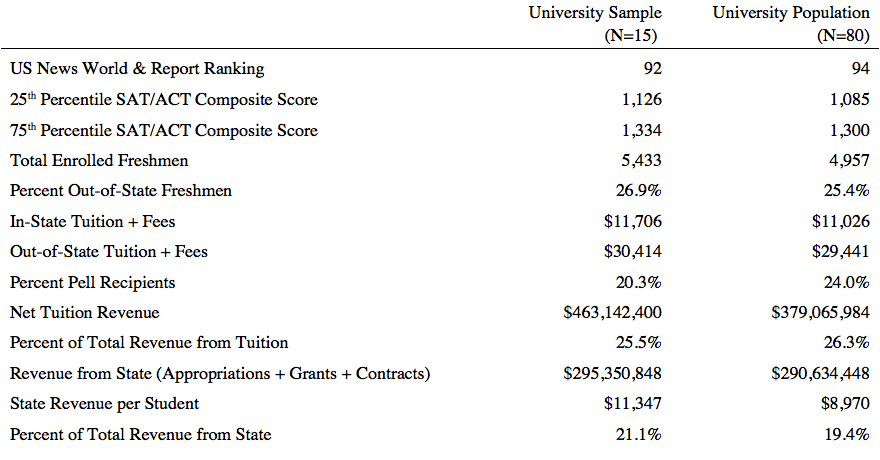
Sample data
Research methods
Defining events
"Off-campus recruiting events" defined as off-campus events hosted by paid staff/consultants focused on soliciting applications
- Event type
- Include: college fairs, high school visits, community college visits, counselor events
- Exclude: admitted or committed student events, interviews
- Event host
- Include: paid admissions staff or consultants (e.g. regional recruiters)
- Exclude: alumni, student volunteers
- Event location
- Any off-campus location
- e.g., high school, community college, hotel, convention center, cafe, etc.
Research methods
Data collection, data processing, data quality
Data collection
- University website checked four times per year by two staff for URLs with recruiting events
- Web-scraping scripts run once per week
Data processing
- "Parsing": transform HTML text into tabular data
- "Geocoding": use Google Maps API to obtain detailed location data based on limited data
- Merge recruiting data to secondary data (e.g., schools, communities)
Data quality (are these data any good?)
- Concern 1: are scraped events properly classified and merged to secondary data?
- Solution: manually check each scraped event
- Concern 2: are all events posted on admissions website?
- Solution: issue public records requests for all off-campus recruiting events
- Received data from 7 of 15 universities
- Main analyses use public records data when available
- Substantive results insensitive to scraped vs. public records data
- Solution: issue public records requests for all off-campus recruiting events
Research methods
Analysis sample
Analysis sample consists of 15 public research universities
- Chosen from larger data collection sample (N=54) based on "completeness" of recruiting event data
- Subsequent drafts may reduce sample size based on principles of purposeful sampling (Patton, 2002)
Research methods
Research design and analyses
Quantitative mulitple case study research design (Korzilius, 2010)
- Quantitative data collection and quantitative analyses
- Analyze each case separately, rather than pooling across cases as in large-N, random sample design
Data analysis (Eisenhardt, 1989; Pratt, Rockmann, and Kaufmann, 2006)
- "Within-case" analyses of recruiting patterns
- broad focus on income, race, achievement, in-state vs. out-of-state
- Situate within local context; "deep dive" of in-state, out-of-state, and overall patterns
- Simple descriptive statistics (e.g., counts), static visualizations, interactive maps
- identify first-order empirical themes
- "Cross-case" analyses
- Abstract/consolidate first-order findings into broader empirical themes
- Acrsoss-case descriptive analyses
- Simple descriptive statistics
- Controlling for "rational" reasons for visit (e.g., enrollment size, achievement, distance)
Table of Contents
- National Overview
- In-State Results
- Out-of-State Results
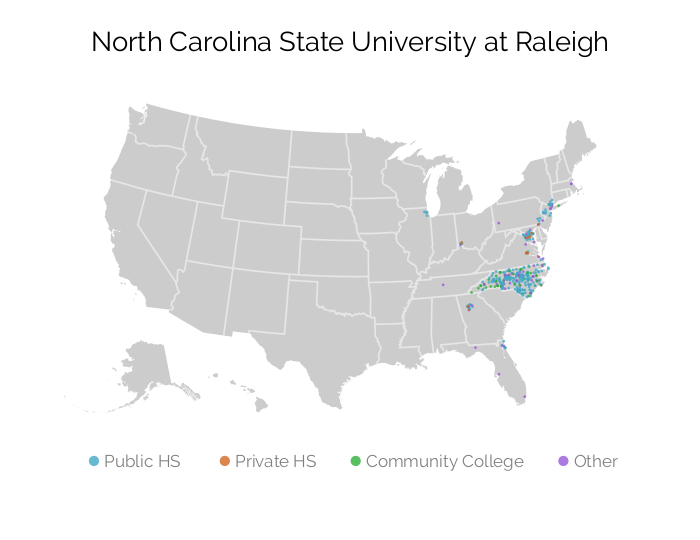
National Overview
In-State Results
State Map
In-State Results
State Figures
In-State Results
Metro Area Map
In-State Results
Metro Area Figures
Out-of-State Results
Top Visited Metro Areas
Out-of-State Results
Out-of-State Results
Metro Area Map
Out-of-State Results
Metro Area Figures
Out-of-State Results
Metro Area Map
Out-of-State Results
Metro Area Figures
Cross-university results
Number of events by type and in-state, out-of-state
| Total Events | Out-of-State | In-State | ||||||||||
|---|---|---|---|---|---|---|---|---|---|---|---|---|
| Total | Pub HS | Priv HS | Other | Total | Pub HS | Priv HS | CC | Other | ||||
| NC State | 371 | 124 | 72 | 20 | 32 | 247 | 157 | 3 | 55 | 32 | ||
| Rutgers | 1,629 | 954 | 560 | 231 | 163 | 675 | 477 | 72 | 89 | 37 | ||
| Stony Brook | 1,101 | 666 | 496 | 107 | 63 | 435 | 326 | 39 | 33 | 37 | ||
| Alabama | 4,349 | 3,957 | 2,312 | 934 | 711 | 392 | 157 | 54 | 124 | 57 | ||
| Arkansas | 1,013 | 788 | 483 | 204 | 101 | 225 | 162 | 21 | 16 | 26 | ||
| UC Berkeley | 906 | 420 | 188 | 134 | 98 | 486 | 269 | 35 | 121 | 61 | ||
| UC Irvine | 939 | 172 | 77 | 40 | 55 | 767 | 330 | 20 | 322 | 95 | ||
| Cincinnati | 1,369 | 815 | 491 | 204 | 120 | 554 | 408 | 79 | 22 | 45 | ||
| CU Boulder | 1,568 | 1,102 | 607 | 362 | 133 | 466 | 256 | 17 | 154 | 39 | ||
| Georgia | 885 | 587 | 287 | 233 | 67 | 298 | 203 | 69 | 1 | 25 | ||
| Kansas | 1,419 | 1,004 | 613 | 213 | 178 | 415 | 304 | 22 | 28 | 61 | ||
| UMass | 1,137 | 784 | 504 | 230 | 50 | 353 | 238 | 62 | 36 | 17 | ||
| Nebraska | 1,421 | 875 | 646 | 104 | 125 | 546 | 445 | 55 | 20 | 26 | ||
| Pittsburgh | 1,233 | 906 | 559 | 210 | 137 | 327 | 211 | 51 | 37 | 28 | ||
| S.Carolina | 1,495 | 1,245 | 676 | 328 | 241 | 250 | 197 | 22 | 2 | 29 | ||
Cross-university results, out-of-state visits
Descriptive statistics for public high school visits
| NC State | Rutgers | Stony Brook | Alabama | Arkansas | UC Berkeley | UC Irvine | Cincinnati | CU Boulder | Georgia | Kansas | UMass | Nebraska | Pittsburgh | S.Carolina | ||||||||||||||||
|---|---|---|---|---|---|---|---|---|---|---|---|---|---|---|---|---|---|---|---|---|---|---|---|---|---|---|---|---|---|---|
| Visit | Nonvisit | Visit | Nonvisit | Visit | Nonvisit | Visit | Nonvisit | Visit | Nonvisit | Visit | Nonvisit | Visit | Nonvisit | Visit | Nonvisit | Visit | Nonvisit | Visit | Nonvisit | Visit | Nonvisit | Visit | Nonvisit | Visit | Nonvisit | Visit | Nonvisit | Visit | Nonvisit | |
| Number of High Schools | 70 | 5,185 | 445 | 6,635 | 407 | 3,613 | 1,711 | 13,255 | 329 | 6,301 | 178 | 10,893 | 74 | 7,521 | 401 | 8,717 | 575 | 12,820 | 249 | 9,333 | 438 | 8,090 | 496 | 8,797 | 420 | 6,003 | 433 | 7,316 | 576 | 11,510 |
| Miles from University | 339 | 437 | 717 | 1,003 | 196 | 506 | 831 | 836 | 406 | 630 | 1,933 | 1,917 | 1,155 | 1,805 | 406 | 720 | 1,139 | 1,116 | 920 | 808 | 519 | 685 | 675 | 1,102 | 374 | 548 | 411 | 614 | 658 | 806 |
| Grade 12 Enrollment | 403 | 201 | 428 | 214 | 332 | 215 | 384 | 169 | 427 | 186 | 459 | 183 | 471 | 191 | 430 | 199 | 431 | 186 | 490 | 201 | 458 | 172 | 380 | 208 | 391 | 144 | 406 | 188 | 431 | 192 |
| Median Household Income ($000) | $121 | $67 | $113 | $66 | $110 | $66 | $90 | $60 | $87 | $59 | $104 | $62 | $93 | $66 | $101 | $64 | $115 | $63 | $102 | $62 | $96 | $62 | $115 | $64 | $85 | $61 | $114 | $64 | $105 | $63 |
| Percent Free or Reduced Lunch | 21.5 | 49.2 | 22.9 | 52.0 | 22.8 | 48.8 | 30.4 | 51.7 | 31.4 | 55.8 | 23.1 | 49.2 | 29.3 | 46.9 | 28.3 | 50.9 | 20.5 | 49.5 | 22.6 | 51.2 | 26.1 | 49.6 | 21.4 | 51.7 | 31.1 | 46.6 | 21.0 | 50.0 | 22.6 | 50.5 |
| Percent Enrollment by Race | ||||||||||||||||||||||||||||||
| Black, Latinx, Native American | 28.7 | 37.1 | 26.2 | 45.6 | 24.0 | 37.0 | 30.3 | 38.0 | 32.5 | 44.3 | 30.4 | 37.4 | 29.9 | 35.5 | 28.9 | 40.5 | 25.4 | 37.6 | 29.6 | 40.9 | 25.4 | 38.2 | 24.5 | 43.6 | 27.1 | 28.8 | 24.3 | 39.7 | 26.7 | 37.9 |
| White | 58.7 | 57.2 | 57.1 | 48.2 | 64.7 | 58.0 | 59.9 | 56.8 | 57.8 | 50.1 | 51.7 | 57.6 | 44.5 | 58.4 | 57.1 | 53.6 | 59.2 | 56.5 | 56.1 | 53.4 | 63.6 | 56.1 | 61.6 | 50.1 | 63.9 | 67.2 | 61.6 | 55.1 | 61.9 | 56.5 |
| Black | 15.9 | 22.1 | 10.1 | 15.4 | 11.8 | 22.1 | 13.8 | 16.3 | 10.8 | 16.4 | 15.0 | 18.1 | 8.1 | 15.7 | 14.6 | 16.7 | 6.6 | 14.9 | 10.3 | 17.1 | 9.8 | 11.7 | 8.5 | 17.7 | 10.2 | 11.6 | 10.7 | 18.7 | 12.0 | 16.3 |
| Latinx | 12.6 | 14.7 | 15.9 | 29.6 | 12.0 | 14.6 | 16.1 | 20.5 | 19.2 | 26.0 | 15.1 | 18.1 | 21.3 | 18.3 | 14.0 | 23.2 | 18.5 | 21.3 | 19.0 | 22.3 | 15.0 | 24.3 | 15.7 | 25.0 | 16.0 | 16.1 | 13.3 | 20.4 | 14.4 | 21.0 |
| Native American | 0.2 | 0.3 | 0.2 | 0.6 | 0.2 | 0.3 | 0.4 | 1.2 | 2.5 | 1.9 | 0.3 | 1.2 | 0.5 | 1.5 | 0.2 | 0.6 | 0.3 | 1.3 | 0.3 | 1.5 | 0.5 | 2.2 | 0.2 | 0.8 | 0.9 | 1.1 | 0.2 | 0.6 | 0.3 | 0.6 |
| Asian | 9.7 | 3.4 | 13.7 | 3.9 | 9.0 | 2.8 | 6.7 | 2.8 | 6.2 | 3.1 | 14.1 | 2.6 | 16.4 | 3.4 | 10.8 | 3.7 | 12.0 | 3.3 | 11.2 | 3.2 | 7.6 | 3.2 | 11.5 | 3.9 | 6.1 | 1.7 | 11.4 | 2.8 | 8.2 | 3.3 |
| Other Race | 2.9 | 2.3 | 3.0 | 2.3 | 2.3 | 2.3 | 3.2 | 2.4 | 3.5 | 2.4 | 3.8 | 2.3 | 9.1 | 2.7 | 3.2 | 2.2 | 3.4 | 2.7 | 3.1 | 2.6 | 3.4 | 2.5 | 2.4 | 2.5 | 2.9 | 2.3 | 2.7 | 2.4 | 3.1 | 2.4 |
| School Type | ||||||||||||||||||||||||||||||
| 0/1 is a Charter School | 0.01 | 0.07 | 0.02 | 0.11 | 0.02 | 0.07 | 0.04 | 0.11 | 0.04 | 0.10 | 0.06 | 0.08 | 0.03 | 0.10 | 0.03 | 0.10 | 0.03 | 0.11 | 0.05 | 0.10 | 0.01 | 0.12 | 0.02 | 0.10 | 0.02 | 0.07 | 0.01 | 0.06 | 0.03 | 0.10 |
| 0/1 is a Magnet School | 0.07 | 0.06 | 0.08 | 0.08 | 0.07 | 0.09 | 0.09 | 0.05 | 0.05 | 0.05 | 0.18 | 0.06 | 0.14 | 0.06 | 0.11 | 0.06 | 0.09 | 0.05 | 0.12 | 0.06 | 0.03 | 0.03 | 0.09 | 0.07 | 0.03 | 0.04 | 0.08 | 0.06 | 0.10 | 0.06 |
| 0/1 is a Regular School | 0.91 | 0.87 | 0.90 | 0.81 | 0.90 | 0.84 | 0.88 | 0.84 | 0.91 | 0.85 | 0.76 | 0.86 | 0.84 | 0.85 | 0.86 | 0.85 | 0.88 | 0.84 | 0.83 | 0.84 | 0.95 | 0.85 | 0.89 | 0.84 | 0.95 | 0.89 | 0.91 | 0.87 | 0.88 | 0.84 |
| Locale | ||||||||||||||||||||||||||||||
| In a City | 0.17 | 0.26 | 0.29 | 0.31 | 0.14 | 0.22 | 0.25 | 0.25 | 0.30 | 0.24 | 0.45 | 0.24 | 0.51 | 0.25 | 0.25 | 0.27 | 0.32 | 0.25 | 0.41 | 0.24 | 0.33 | 0.22 | 0.22 | 0.28 | 0.31 | 0.18 | 0.19 | 0.26 | 0.21 | 0.26 |
| In a Suburb | 0.64 | 0.35 | 0.64 | 0.31 | 0.73 | 0.39 | 0.58 | 0.23 | 0.49 | 0.20 | 0.48 | 0.26 | 0.39 | 0.32 | 0.63 | 0.28 | 0.62 | 0.27 | 0.52 | 0.29 | 0.56 | 0.22 | 0.68 | 0.28 | 0.46 | 0.17 | 0.70 | 0.28 | 0.68 | 0.28 |
| In a Town | 0.03 | 0.11 | 0.01 | 0.11 | 0.01 | 0.12 | 0.04 | 0.15 | 0.07 | 0.15 | 0.02 | 0.14 | 0.03 | 0.13 | 0.03 | 0.13 | 0.01 | 0.14 | 0.00 | 0.13 | 0.03 | 0.16 | 0.02 | 0.12 | 0.10 | 0.17 | 0.02 | 0.12 | 0.01 | 0.13 |
| In a Rural Area | 0.16 | 0.27 | 0.07 | 0.28 | 0.11 | 0.27 | 0.13 | 0.37 | 0.14 | 0.41 | 0.05 | 0.36 | 0.07 | 0.30 | 0.09 | 0.32 | 0.05 | 0.34 | 0.07 | 0.34 | 0.08 | 0.40 | 0.08 | 0.31 | 0.14 | 0.48 | 0.08 | 0.33 | 0.09 | 0.33 |
Cross-university results, out-of-state visits
Probability of out-of-state public high school receiving a visit
| NC State | Rutgers | Stony Brook | Alabama | Arkansas | UC Berkeley | UC Irvine | Cincinnati | CU Boulder | Georgia | Kansas | UMass | Nebraska | Pittsburgh | S.Carolina | |
|---|---|---|---|---|---|---|---|---|---|---|---|---|---|---|---|
| Income (ref=<$50k) | |||||||||||||||
| $50k-$74k | -0.001 (0.002) | -0.011** (0.004) | -0.020** (0.007) | 0.004 (0.004) | 0.002 (0.004) | -0.003 (0.002) | -0.001 (0.002) | 0.001 (0.003) | -0.008*** (0.002) | -0.004 (0.003) | -0.003 (0.004) | -0.011*** (0.003) | 0.001 (0.005) | -0.010** (0.003) | -0.001 (0.003) |
| $75k-$99k | 0.005 (0.005) | 0.019* (0.008) | 0.016 (0.013) | 0.081*** (0.009) | 0.044*** (0.010) | 0.006 (0.004) | 0.006 (0.004) | 0.030*** (0.007) | 0.024*** (0.005) | 0.008 (0.006) | 0.051*** (0.008) | 0.022** (0.007) | 0.049*** (0.010) | 0.032*** (0.008) | 0.031*** (0.006) |
| $100k-$149k | 0.047*** (0.009) | 0.173*** (0.014) | 0.185*** (0.021) | 0.207*** (0.014) | 0.184*** (0.023) | 0.060*** (0.009) | 0.042*** (0.008) | 0.115*** (0.012) | 0.170*** (0.011) | 0.068*** (0.011) | 0.183*** (0.017) | 0.178*** (0.013) | 0.191*** (0.025) | 0.153*** (0.014) | 0.155*** (0.012) |
| $150k-$199k | 0.166*** (0.047) | 0.393*** (0.050) | 0.433*** (0.057) | 0.415*** (0.041) | 0.066 (0.047) | 0.193*** (0.045) | 0.033 (0.020) | 0.276*** (0.045) | 0.501*** (0.044) | 0.168*** (0.041) | 0.231*** (0.051) | 0.444*** (0.049) | 0.225* (0.089) | 0.480*** (0.050) | 0.314*** (0.043) |
| $200k+ | 0.104 (0.077) | 0.398*** (0.089) | 0.482*** (0.120) | 0.481*** (0.075) | 0.398** (0.141) | 0.241** (0.089) | 0.005 (0.005) | 0.248*** (0.075) | 0.766*** (0.066) | 0.362*** (0.108) | 0.385** (0.118) | 0.654*** (0.078) | 0.084 (0.129) | 0.550*** (0.095) | 0.265*** (0.079) |
| BL, LX, NA Enrollment (ref=<20%) | |||||||||||||||
| 20-39% | 0.002 (0.006) | 0.001 (0.010) | -0.010 (0.015) | 0.030*** (0.008) | 0.026** (0.008) | -0.002 (0.004) | -0.004 (0.004) | 0.012 (0.007) | 0.007 (0.005) | 0.003 (0.005) | 0.028*** (0.007) | -0.016* (0.008) | 0.023* (0.009) | -0.001 (0.008) | 0.026*** (0.007) |
| 40-59% | -0.012* (0.005) | -0.038*** (0.010) | -0.028 (0.016) | -0.011 (0.008) | -0.00004 (0.008) | -0.015*** (0.004) | 0.002 (0.005) | 0.012 (0.008) | -0.015** (0.006) | -0.011* (0.005) | -0.016* (0.007) | -0.030*** (0.008) | 0.002 (0.011) | -0.020* (0.009) | -0.010 (0.007) |
| 60-79% | 0.007 (0.008) | -0.048*** (0.011) | -0.054** (0.017) | -0.047*** (0.009) | -0.007 (0.009) | -0.013** (0.005) | -0.004 (0.005) | -0.0004 (0.009) | -0.036*** (0.006) | -0.027*** (0.005) | -0.032*** (0.008) | -0.040*** (0.008) | 0.011 (0.012) | -0.040*** (0.008) | -0.021** (0.007) |
| 80-89% | 0.005 (0.009) | -0.070*** (0.011) | -0.078*** (0.020) | -0.042*** (0.011) | -0.022* (0.009) | -0.021*** (0.005) | -0.011* (0.005) | -0.007 (0.009) | -0.052*** (0.006) | -0.035*** (0.006) | -0.034*** (0.009) | -0.056*** (0.008) | -0.023 (0.014) | -0.042*** (0.010) | -0.028*** (0.007) |
| 90%+ | -0.0004 (0.005) | -0.075*** (0.010) | -0.087*** (0.015) | -0.073*** (0.008) | -0.026** (0.008) | -0.027*** (0.004) | -0.011** (0.004) | -0.012 (0.007) | -0.051*** (0.005) | -0.036*** (0.005) | -0.032*** (0.007) | -0.062*** (0.007) | -0.006 (0.011) | -0.050*** (0.008) | -0.031*** (0.006) |
| # Math Proficient Students (ref=<50) | |||||||||||||||
| 50-99 | -0.004* (0.002) | -0.012* (0.005) | 0.003 (0.013) | -0.004 (0.005) | -0.003 (0.006) | -0.003 (0.002) | -0.0005 (0.003) | -0.006 (0.004) | -0.005 (0.003) | -0.003 (0.002) | -0.005 (0.005) | 0.007 (0.005) | 0.061*** (0.009) | -0.004 (0.005) | -0.004 (0.003) |
| 100-199 | 0.0003 (0.004) | -0.004 (0.009) | -0.014 (0.014) | 0.028*** (0.008) | 0.018 (0.010) | -0.0004 (0.004) | -0.008 (0.004) | -0.011 (0.007) | 0.0002 (0.006) | 0.003 (0.004) | -0.014 (0.008) | 0.001 (0.007) | 0.070*** (0.013) | -0.006 (0.007) | -0.007 (0.005) |
| 200-299 | 0.012 (0.007) | 0.019 (0.014) | 0.003 (0.020) | 0.056*** (0.014) | 0.029 (0.018) | 0.005 (0.007) | -0.014* (0.007) | -0.037*** (0.011) | -0.006 (0.010) | 0.022* (0.008) | -0.015 (0.015) | 0.011 (0.011) | 0.078*** (0.021) | 0.011 (0.013) | -0.011 (0.010) |
| 300-399 | 0.014 (0.011) | -0.022 (0.017) | 0.022 (0.025) | 0.053** (0.019) | 0.088*** (0.027) | 0.005 (0.010) | -0.017 (0.010) | -0.024 (0.016) | -0.001 (0.014) | 0.045*** (0.013) | -0.028 (0.021) | 0.032* (0.015) | -0.013 (0.025) | 0.007 (0.017) | 0.033* (0.015) |
| 400+ | 0.030** (0.011) | -0.001 (0.016) | -0.043* (0.019) | 0.137*** (0.020) | 0.003 (0.026) | 0.011 (0.011) | -0.028** (0.009) | -0.011 (0.017) | -0.034** (0.013) | 0.004 (0.012) | -0.149*** (0.015) | 0.022 (0.013) | -0.098*** (0.023) | -0.060*** (0.016) | 0.068*** (0.016) |
| # G12 Students (ref=<50) | |||||||||||||||
| 50-99 | -0.003 (0.002) | -0.001 (0.004) | 0.014 (0.009) | 0.006 (0.004) | 0.014*** (0.004) | 0.001 (0.002) | 0.006** (0.002) | 0.001 (0.003) | 0.004 (0.002) | -0.001 (0.002) | 0.014*** (0.003) | -0.005 (0.004) | 0.006 (0.005) | -0.004 (0.004) | 0.001 (0.002) |
| 100-199 | -0.001 (0.004) | -0.001 (0.006) | 0.016 (0.011) | 0.015** (0.005) | 0.032*** (0.006) | -0.0004 (0.002) | 0.009** (0.003) | 0.006 (0.005) | -0.001 (0.003) | -0.002 (0.003) | 0.036*** (0.006) | 0.002 (0.005) | 0.026** (0.008) | -0.003 (0.006) | 0.001 (0.003) |
| 200-299 | -0.012* (0.005) | 0.030** (0.010) | 0.065*** (0.016) | 0.075*** (0.009) | 0.043*** (0.010) | 0.001 (0.004) | 0.018*** (0.005) | 0.024*** (0.007) | 0.012* (0.005) | -0.007 (0.004) | 0.076*** (0.010) | 0.017* (0.008) | 0.065*** (0.014) | 0.014 (0.009) | 0.018** (0.006) |
| 300-399 | 0.010 (0.008) | 0.080*** (0.014) | 0.085*** (0.019) | 0.162*** (0.013) | 0.078*** (0.014) | 0.013* (0.007) | 0.031*** (0.007) | 0.063*** (0.010) | 0.042*** (0.008) | 0.014 (0.008) | 0.148*** (0.014) | 0.019 (0.010) | 0.143*** (0.020) | 0.056*** (0.013) | 0.049*** (0.009) |
| 400-499 | 0.008 (0.011) | 0.086*** (0.016) | 0.138*** (0.025) | 0.198*** (0.016) | 0.105*** (0.018) | 0.040*** (0.009) | 0.031*** (0.009) | 0.135*** (0.015) | 0.071*** (0.011) | 0.046*** (0.011) | 0.200*** (0.017) | 0.012 (0.012) | 0.190*** (0.024) | 0.096*** (0.018) | 0.058*** (0.012) |
| 500+ | 0.016 (0.013) | 0.125*** (0.017) | 0.125*** (0.026) | 0.201*** (0.017) | 0.124*** (0.018) | 0.059*** (0.012) | 0.075*** (0.013) | 0.149*** (0.016) | 0.128*** (0.013) | 0.094*** (0.012) | 0.249*** (0.016) | 0.048*** (0.013) | 0.283*** (0.028) | 0.175*** (0.022) | 0.126*** (0.015) |
| Locale (ref=suburb) | |||||||||||||||
| City | 0.003 (0.005) | 0.021* (0.009) | -0.0001 (0.013) | -0.011 (0.008) | -0.004 (0.010) | 0.029*** (0.006) | 0.020*** (0.005) | -0.006 (0.007) | 0.026*** (0.006) | 0.035*** (0.006) | 0.019* (0.009) | -0.007 (0.007) | 0.029* (0.014) | 0.0003 (0.008) | -0.007 (0.006) |
| Rural | 0.007 (0.005) | -0.031*** (0.008) | -0.047*** (0.013) | -0.049*** (0.008) | -0.039*** (0.010) | 0.003 (0.004) | 0.006* (0.003) | -0.018** (0.006) | -0.023*** (0.005) | -0.001 (0.004) | -0.040*** (0.008) | -0.045*** (0.007) | -0.024* (0.010) | -0.031*** (0.007) | -0.024*** (0.006) |
| Town | 0.008 (0.005) | -0.021** (0.007) | -0.048*** (0.012) | -0.051*** (0.008) | -0.031** (0.010) | 0.006 (0.004) | 0.004 (0.003) | -0.013* (0.006) | -0.015*** (0.004) | 0.001 (0.004) | -0.040*** (0.008) | -0.037*** (0.006) | -0.030** (0.011) | -0.020** (0.007) | -0.024*** (0.005) |
| School Type (ref=regular school) | |||||||||||||||
| Charter | -0.001 (0.004) | 0.006 (0.007) | 0.006 (0.015) | 0.017* (0.007) | 0.044*** (0.009) | 0.006 (0.004) | -0.005 (0.003) | 0.032*** (0.006) | -0.010* (0.004) | 0.004 (0.005) | 0.028*** (0.006) | -0.005 (0.005) | -0.005 (0.009) | -0.001 (0.007) | 0.012* (0.005) |
| Magnet | -0.006 (0.008) | -0.011 (0.011) | 0.036* (0.017) | 0.014 (0.013) | -0.012 (0.012) | 0.028*** (0.008) | 0.014* (0.007) | 0.031** (0.011) | 0.017 (0.009) | -0.0002 (0.009) | -0.024 (0.014) | 0.025* (0.010) | -0.013 (0.015) | 0.007 (0.011) | 0.006 (0.009) |
| Distance (in 10 miles) | -0.001*** (0.0001) | -0.0002*** (0.00005) | -0.002*** (0.0001) | -0.0004*** (0.0001) | -0.001*** (0.0001) | -0.0001* (0.00002) | -0.0001*** (0.00003) | -0.001*** (0.00005) | -0.0003*** (0.00004) | -0.00005 (0.00004) | -0.002*** (0.0001) | -0.0002*** (0.00003) | -0.003*** (0.0002) | -0.0004*** (0.00005) | -0.0004*** (0.00004) |
| Constant | 0.020* (0.008) | 0.059*** (0.009) | 0.136*** (0.016) | 0.073*** (0.010) | 0.080*** (0.012) | 0.009 (0.007) | 0.011 (0.007) | 0.053*** (0.008) | 0.048*** (0.007) | 0.008 (0.006) | 0.108*** (0.010) | 0.080*** (0.009) | 0.146*** (0.014) | 0.060*** (0.009) | 0.043*** (0.007) |
| Observations | 5,255 | 7,080 | 4,020 | 14,966 | 6,630 | 11,071 | 7,595 | 9,118 | 13,395 | 9,582 | 8,528 | 9,293 | 6,423 | 7,749 | 12,086 |
| Akaike Inf. Crit. | -8,194.420 | -1,519.028 | 795.540 | 4,098.966 | -2,687.272 | -15,443.180 | -14,152.570 | -4,444.550 | -8,207.670 | -9,137.670 | -3,973.770 | -3,464.868 | -1,616.831 | -2,627.812 | -5,393.591 |
*p<0.05; **p<0.01; ***p<0.001; Dependent Variable: Received a recruiting visit (0/1); Robust standard errors in parentheses; Schools that satisfied the following criteria were included in the sample: offers grades 9-12 and enrolls at least ten student in each grade; located in the 50 U.S. states, the District of Columbia, or land regulated by the Bureau of Indian Affairs; is not special education school, an alternative school, or a virtual school.
Cross-university results, out-of-state visits
Descriptive statistics for private high school visits
| NC State | Rutgers | Stony Brook | Alabama | Arkansas | UC Berkeley | UC Irvine | Cincinnati | CU Boulder | Georgia | Kansas | UMass | Nebraska | Pittsburgh | S.Carolina | ||||||||||||||||
|---|---|---|---|---|---|---|---|---|---|---|---|---|---|---|---|---|---|---|---|---|---|---|---|---|---|---|---|---|---|---|
| Visit | Nonvisit | Visit | Nonvisit | Visit | Nonvisit | Visit | Nonvisit | Visit | Nonvisit | Visit | Nonvisit | Visit | Nonvisit | Visit | Nonvisit | Visit | Nonvisit | Visit | Nonvisit | Visit | Nonvisit | Visit | Nonvisit | Visit | Nonvisit | Visit | Nonvisit | Visit | Nonvisit | |
| Number of High Schools | 19 | 1,535 | 188 | 1,723 | 83 | 1,206 | 681 | 2,788 | 144 | 1,256 | 130 | 2,444 | 37 | 1,852 | 167 | 2,059 | 327 | 2,780 | 192 | 2,152 | 150 | 1,414 | 218 | 2,254 | 66 | 951 | 172 | 1,828 | 285 | 2,660 |
| Grade 12 Enrollment | 161 | 70 | 156 | 64 | 144 | 66 | 125 | 55 | 123 | 59 | 123 | 64 | 188 | 69 | 145 | 64 | 145 | 62 | 134 | 62 | 164 | 60 | 149 | 63 | 169 | 60 | 145 | 62 | 140 | 63 |
| Percent Enrollment by Race | ||||||||||||||||||||||||||||||
| Black, Latinx, Native American | 21.1 | 22.5 | 16.9 | 24.8 | 17.2 | 23.8 | 17.0 | 21.1 | 16.6 | 22.0 | 16.4 | 21.0 | 16.7 | 20.6 | 14.6 | 20.8 | 17.5 | 21.4 | 13.5 | 22.8 | 16.1 | 21.3 | 16.1 | 23.0 | 14.9 | 20.1 | 15.3 | 21.9 | 15.0 | 22.0 |
| White | 69.8 | 68.0 | 68.2 | 62.3 | 69.8 | 66.2 | 71.0 | 68.4 | 73.8 | 65.7 | 69.8 | 70.0 | 49.4 | 68.7 | 73.9 | 67.3 | 65.9 | 66.8 | 74.5 | 65.8 | 73.0 | 65.6 | 69.4 | 65.2 | 76.5 | 71.2 | 71.9 | 68.4 | 74.3 | 66.7 |
| Black | 15.1 | 13.3 | 8.9 | 10.9 | 7.1 | 14.3 | 7.1 | 11.0 | 7.4 | 9.7 | 7.8 | 11.4 | 5.6 | 10.8 | 8.3 | 10.4 | 6.5 | 10.7 | 5.9 | 11.3 | 6.0 | 8.8 | 6.6 | 11.3 | 4.0 | 9.6 | 8.1 | 11.1 | 7.2 | 11.1 |
| Latinx | 5.8 | 9.0 | 7.7 | 13.6 | 9.8 | 9.3 | 9.5 | 9.6 | 8.6 | 11.8 | 8.1 | 9.2 | 9.6 | 9.3 | 6.1 | 10.0 | 10.5 | 10.2 | 7.2 | 11.2 | 9.5 | 12.0 | 9.1 | 11.3 | 9.1 | 10.1 | 6.8 | 10.5 | 7.4 | 10.6 |
| Native American | 0.2 | 0.3 | 0.4 | 0.3 | 0.3 | 0.3 | 0.4 | 0.5 | 0.5 | 0.4 | 0.6 | 0.4 | 1.4 | 0.6 | 0.2 | 0.3 | 0.4 | 0.5 | 0.5 | 0.3 | 0.6 | 0.4 | 0.4 | 0.3 | 1.8 | 0.4 | 0.4 | 0.3 | 0.3 | 0.3 |
| Asian | 5.4 | 5.9 | 9.3 | 8.5 | 9.2 | 6.4 | 7.2 | 6.9 | 6.0 | 8.0 | 8.2 | 5.7 | 15.5 | 6.9 | 7.7 | 7.7 | 9.2 | 7.6 | 6.8 | 7.3 | 6.0 | 8.6 | 8.6 | 7.7 | 5.1 | 5.6 | 8.3 | 6.2 | 6.7 | 7.3 |
| Other Race | 3.7 | 3.5 | 5.6 | 4.4 | 3.9 | 3.6 | 4.9 | 3.6 | 3.5 | 4.4 | 5.6 | 3.3 | 18.5 | 3.8 | 3.8 | 4.2 | 7.3 | 4.1 | 5.2 | 4.1 | 4.9 | 4.5 | 5.9 | 4.1 | 3.5 | 3.1 | 4.6 | 3.5 | 4.0 | 4.0 |
| Locale | ||||||||||||||||||||||||||||||
| In a City | 0.32 | 0.37 | 0.43 | 0.45 | 0.25 | 0.29 | 0.49 | 0.38 | 0.65 | 0.44 | 0.57 | 0.38 | 0.54 | 0.38 | 0.49 | 0.43 | 0.52 | 0.41 | 0.60 | 0.38 | 0.57 | 0.41 | 0.47 | 0.41 | 0.62 | 0.42 | 0.41 | 0.41 | 0.47 | 0.41 |
| In a Suburb | 0.68 | 0.45 | 0.50 | 0.40 | 0.66 | 0.49 | 0.41 | 0.38 | 0.29 | 0.30 | 0.36 | 0.40 | 0.30 | 0.45 | 0.44 | 0.37 | 0.42 | 0.39 | 0.33 | 0.41 | 0.41 | 0.34 | 0.42 | 0.40 | 0.29 | 0.33 | 0.52 | 0.40 | 0.45 | 0.40 |
| In a Town | 0.00 | 0.04 | 0.01 | 0.03 | 0.00 | 0.04 | 0.02 | 0.07 | 0.00 | 0.08 | 0.01 | 0.06 | 0.03 | 0.04 | 0.02 | 0.05 | 0.01 | 0.06 | 0.00 | 0.06 | 0.02 | 0.09 | 0.01 | 0.05 | 0.02 | 0.10 | 0.01 | 0.04 | 0.01 | 0.05 |
| In a Rural Area | 0.00 | 0.13 | 0.06 | 0.12 | 0.08 | 0.17 | 0.09 | 0.17 | 0.06 | 0.18 | 0.06 | 0.16 | 0.14 | 0.13 | 0.05 | 0.15 | 0.06 | 0.14 | 0.07 | 0.15 | 0.01 | 0.16 | 0.10 | 0.14 | 0.08 | 0.14 | 0.06 | 0.15 | 0.07 | 0.14 |
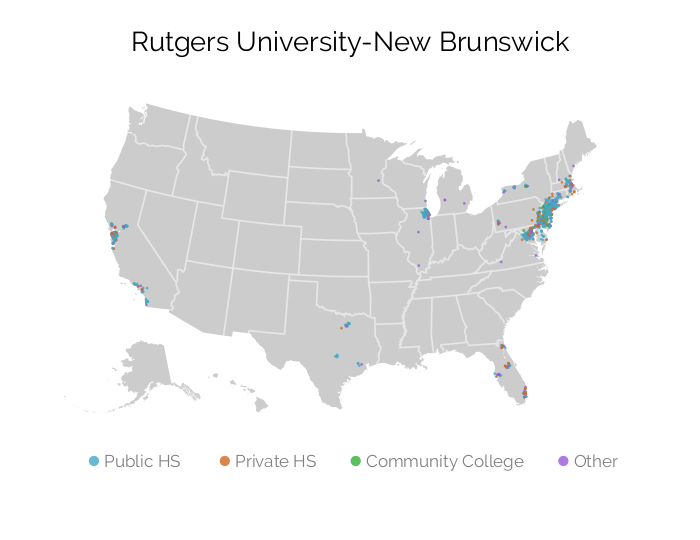
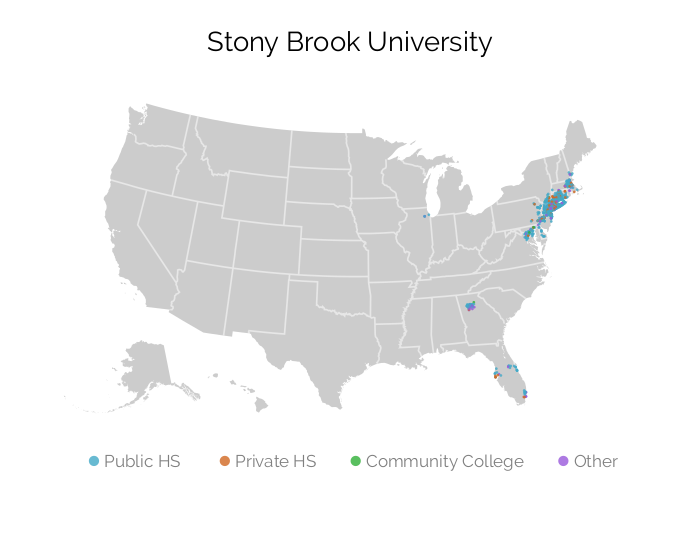
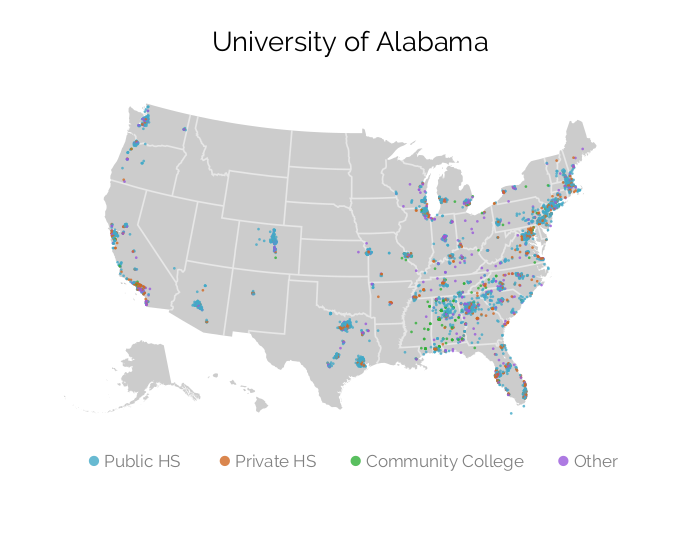
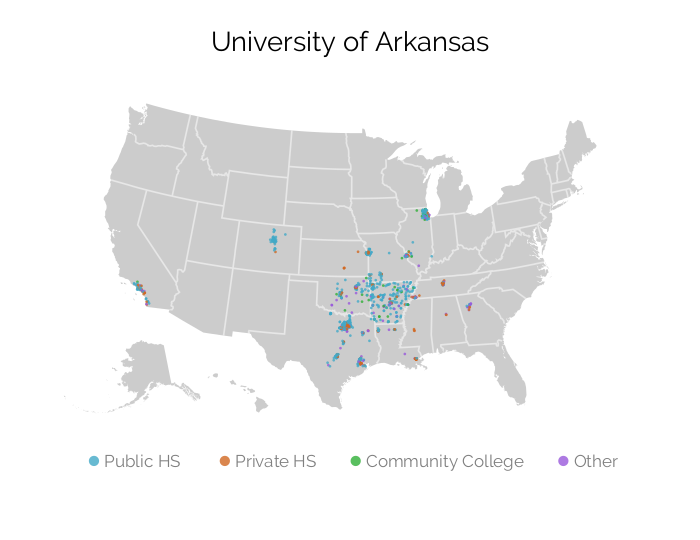
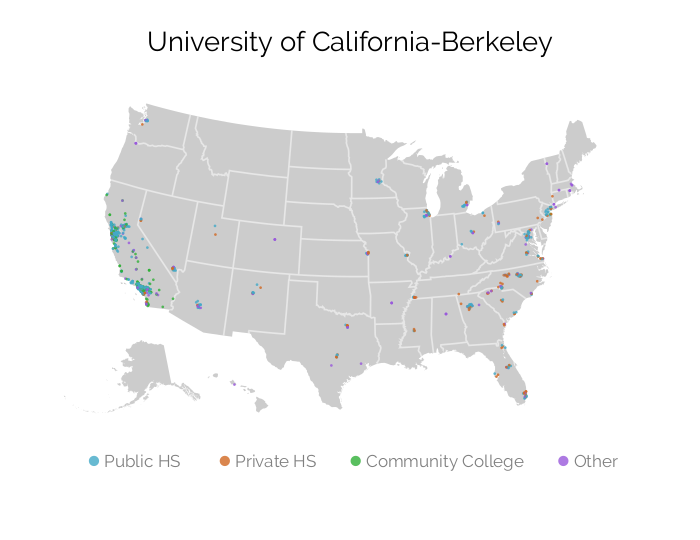
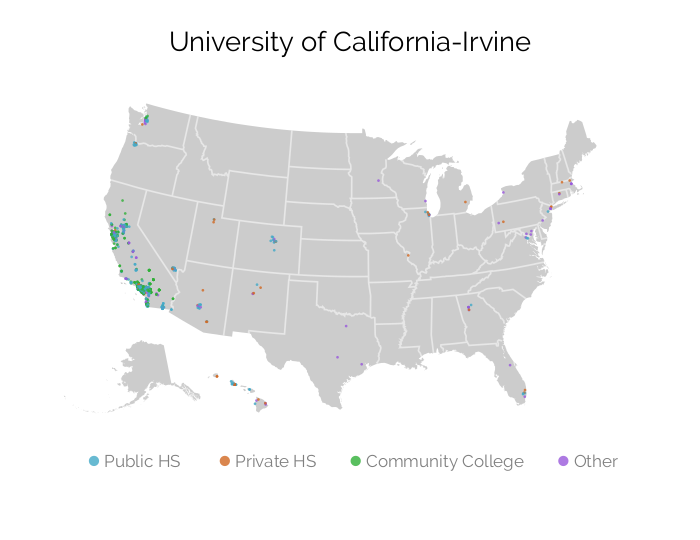
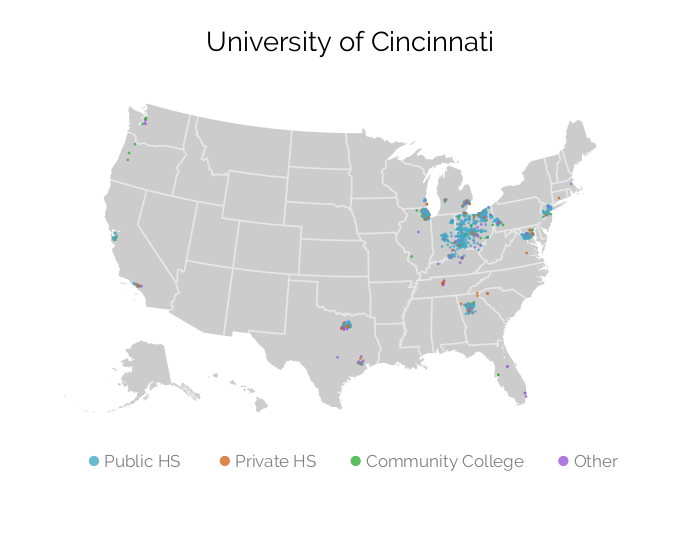
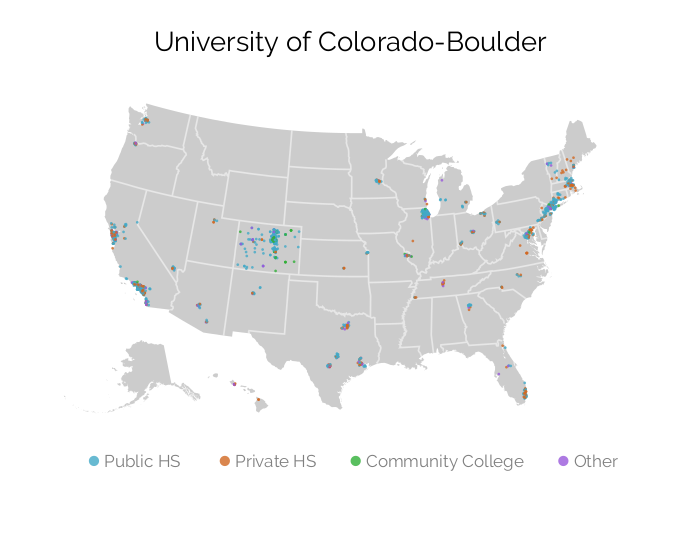
Cross-university results, out-of-state visits
Small multiple map of recruiting visits
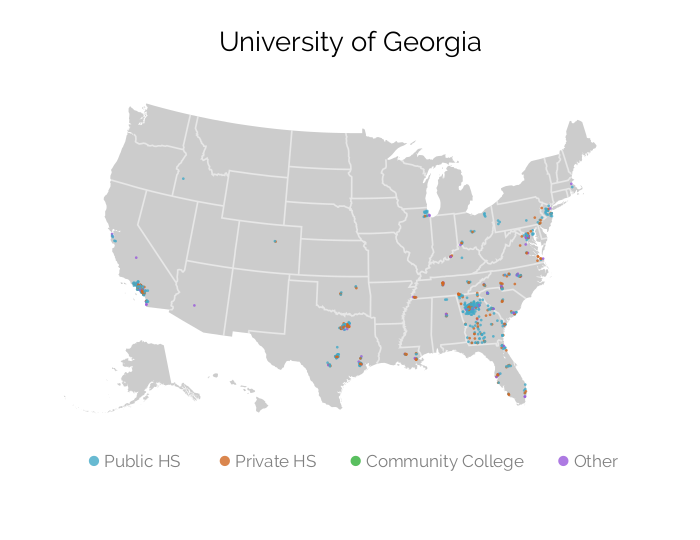
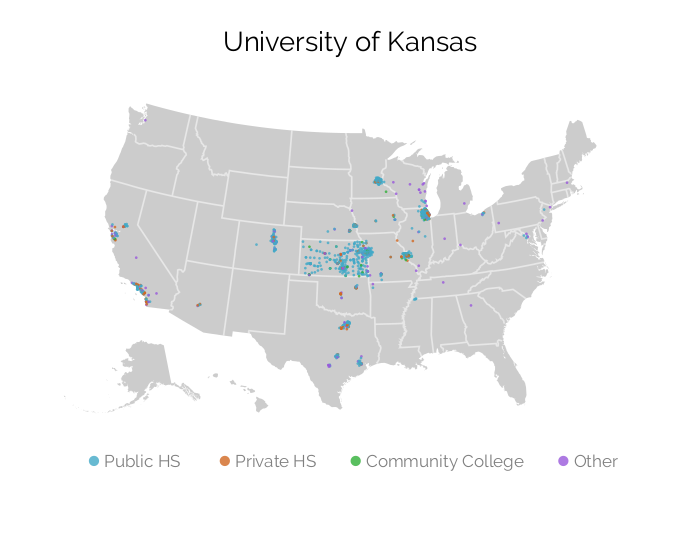
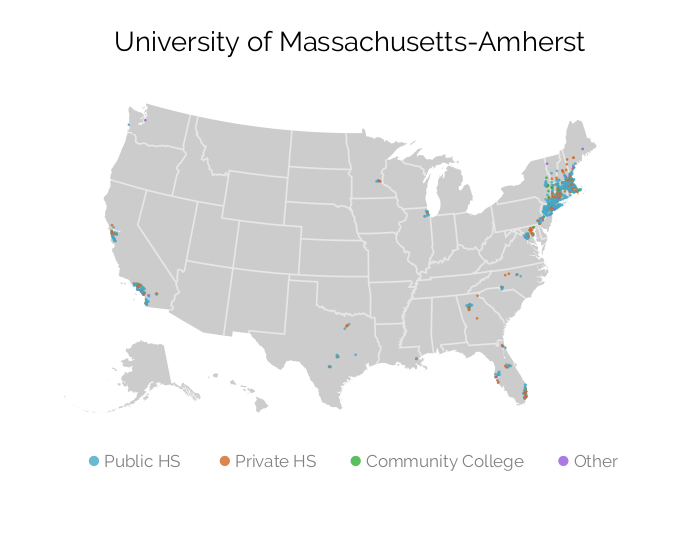
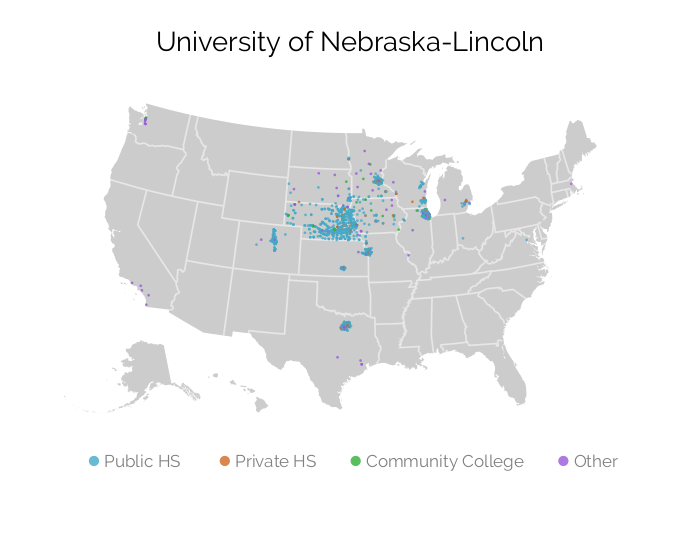
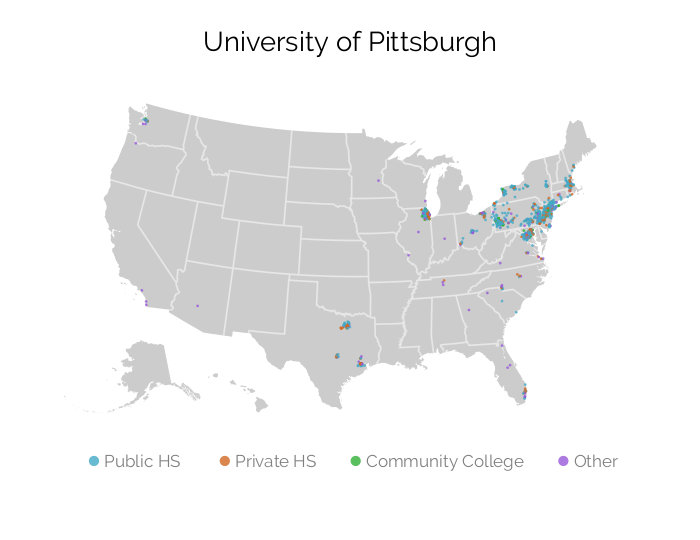
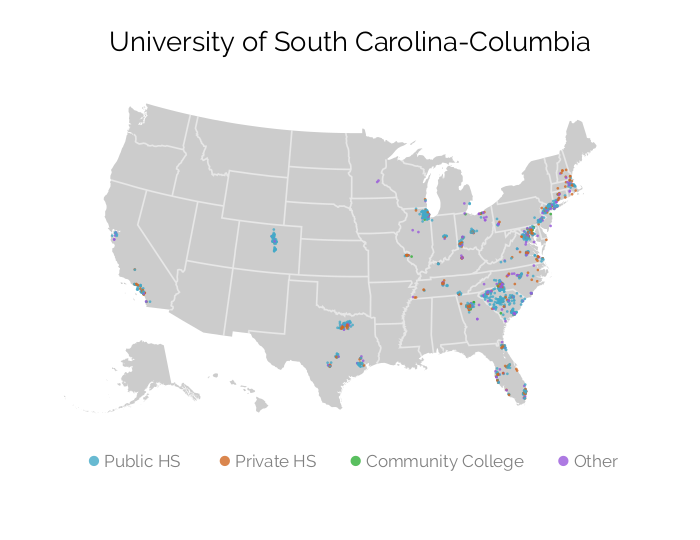
Cross-university results, in-state visits
Descriptive statistics for public high school visits
| NC State | Rutgers | Stony Brook | Alabama | Arkansas | UC Berkeley | UC Irvine | Cincinnati | CU Boulder | Georgia | Kansas | UMass | Nebraska | Pittsburgh | S.Carolina | ||||||||||||||||
|---|---|---|---|---|---|---|---|---|---|---|---|---|---|---|---|---|---|---|---|---|---|---|---|---|---|---|---|---|---|---|
| Visit | Nonvisit | Visit | Nonvisit | Visit | Nonvisit | Visit | Nonvisit | Visit | Nonvisit | Visit | Nonvisit | Visit | Nonvisit | Visit | Nonvisit | Visit | Nonvisit | Visit | Nonvisit | Visit | Nonvisit | Visit | Nonvisit | Visit | Nonvisit | Visit | Nonvisit | Visit | Nonvisit | |
| Number of High Schools | 143 | 361 | 253 | 147 | 229 | 927 | 113 | 228 | 124 | 113 | 244 | 1,160 | 232 | 1,172 | 353 | 464 | 181 | 132 | 173 | 245 | 209 | 108 | 216 | 132 | 217 | 30 | 185 | 467 | 119 | 90 |
| Percent of High Schools | 28.4 | 71.6 | 63.2 | 36.8 | 19.8 | 80.2 | 33.1 | 66.9 | 52.3 | 47.7 | 17.4 | 82.6 | 16.5 | 83.5 | 43.2 | 56.8 | 57.8 | 42.2 | 41.4 | 58.6 | 65.9 | 34.1 | 62.1 | 37.9 | 87.9 | 12.1 | 28.4 | 71.6 | 56.9 | 43.1 |
| Miles from University | 87 | 103 | 31 | 35 | 35 | 144 | 98 | 101 | 131 | 137 | 171 | 250 | 131 | 216 | 119 | 157 | 61 | 108 | 85 | 98 | 118 | 168 | 61 | 65 | 112 | 149 | 131 | 155 | 65 | 80 |
| Grade 12 Enrollment | 239 | 169 | 259 | 186 | 318 | 118 | 204 | 97 | 132 | 66 | 446 | 272 | 467 | 269 | 199 | 83 | 257 | 53 | 313 | 207 | 135 | 31 | 214 | 158 | 101 | 27 | 288 | 134 | 264 | 127 |
| Number Proficient-Math | 109 | 76 | 105 | 59 | 303 | 103 | 53 | 14 | 51 | 20 | 143 | 74 | 129 | 77 | 183 | 80 | 91 | 16 | 141 | 71 | 36 | 6 | 179 | 116 | 58 | 14 | 205 | 76 | 226 | 112 |
| Median Household Income ($000) | $52 | $53 | $95 | $86 | $103 | $64 | $54 | $44 | $46 | $45 | $86 | $67 | $69 | $71 | $67 | $53 | $75 | $61 | $61 | $50 | $65 | $57 | $95 | $82 | $63 | $62 | $79 | $59 | $53 | $45 |
| Percent Free or Reduced Lunch | 53.3 | 50.9 | 35.1 | 34.0 | 37.3 | 55.6 | 44.3 | 60.3 | 59.2 | 65.6 | 50.6 | 58.4 | 61.6 | 56.2 | 40.1 | 53.6 | 36.8 | 46.1 | 55.5 | 68.0 | 42.9 | 47.5 | 32.9 | 48.2 | 37.3 | 44.2 | 31.5 | 51.8 | 49.8 | 65.7 |
| Percent Enrollment by Race | ||||||||||||||||||||||||||||||
| Black, Latinx, Native American | 38.8 | 41.6 | 42.6 | 40.5 | 37.7 | 45.0 | 33.0 | 38.8 | 24.7 | 26.8 | 54.9 | 59.7 | 68.4 | 56.9 | 22.0 | 21.1 | 37.7 | 34.6 | 50.1 | 52.2 | 17.5 | 14.2 | 21.8 | 33.6 | 13.8 | 15.6 | 15.7 | 25.6 | 42.1 | 52.5 |
| White | 55.9 | 52.6 | 46.7 | 53.2 | 48.7 | 50.0 | 64.3 | 59.8 | 72.5 | 71.1 | 25.6 | 28.9 | 17.5 | 30.5 | 72.4 | 75.0 | 56.1 | 61.7 | 43.1 | 43.7 | 77.4 | 82.6 | 70.4 | 60.9 | 83.4 | 82.0 | 78.3 | 71.0 | 54.1 | 44.8 |
| Black | 24.4 | 27.8 | 19.5 | 17.9 | 13.9 | 21.8 | 27.2 | 33.4 | 16.9 | 21.1 | 6.1 | 6.5 | 8.6 | 6.0 | 18.4 | 17.2 | 4.3 | 2.9 | 40.3 | 42.2 | 4.2 | 2.6 | 8.6 | 12.4 | 2.1 | 3.8 | 11.4 | 17.7 | 36.1 | 47.4 |
| Latinx | 11.8 | 12.7 | 22.9 | 22.4 | 23.5 | 22.5 | 4.7 | 4.2 | 7.0 | 5.0 | 48.2 | 51.9 | 59.2 | 49.7 | 3.4 | 3.7 | 32.5 | 30.9 | 9.6 | 9.7 | 12.1 | 10.2 | 13.0 | 20.9 | 9.6 | 7.8 | 4.2 | 7.8 | 5.7 | 4.9 |
| Native American | 2.7 | 1.1 | 0.1 | 0.1 | 0.4 | 0.7 | 1.2 | 1.3 | 0.8 | 0.6 | 0.6 | 1.2 | 0.6 | 1.2 | 0.1 | 0.1 | 1.0 | 0.8 | 0.2 | 0.2 | 1.2 | 1.4 | 0.2 | 0.3 | 2.1 | 4.0 | 0.1 | 0.1 | 0.3 | 0.3 |
| Asian | 1.9 | 2.4 | 9.7 | 5.2 | 12.4 | 3.9 | 1.4 | 0.4 | 1.2 | 0.9 | 15.3 | 8.0 | 11.1 | 8.9 | 2.0 | 0.7 | 2.9 | 1.2 | 4.0 | 1.5 | 1.5 | 0.5 | 5.4 | 2.9 | 1.0 | 0.5 | 4.0 | 1.7 | 1.3 | 0.7 |
| Other Race | 3.4 | 3.4 | 1.0 | 1.1 | 1.2 | 1.2 | 1.2 | 1.0 | 1.6 | 1.3 | 4.2 | 3.4 | 3.0 | 3.7 | 3.7 | 3.2 | 3.2 | 2.5 | 2.8 | 2.6 | 3.6 | 2.7 | 2.4 | 2.5 | 1.7 | 1.9 | 2.0 | 1.7 | 2.5 | 2.0 |
| School Type | ||||||||||||||||||||||||||||||
| 0/1 is a Charter School | 0.02 | 0.08 | 0.04 | 0.06 | 0.00 | 0.04 | 0.00 | 0.00 | 0.06 | 0.04 | 0.07 | 0.31 | 0.06 | 0.31 | 0.02 | 0.18 | 0.08 | 0.19 | 0.05 | 0.04 | 0.00 | 0.01 | 0.10 | 0.09 | 0.00 | 0.00 | 0.02 | 0.13 | 0.05 | 0.10 |
| 0/1 is a Magnet School | 0.02 | 0.04 | 0.00 | 0.00 | 0.03 | 0.01 | 0.04 | 0.03 | 0.01 | 0.02 | 0.12 | 0.09 | 0.15 | 0.09 | 0.00 | 0.00 | 0.01 | 0.01 | 0.09 | 0.08 | 0.01 | 0.00 | 0.00 | 0.00 | 0.00 | 0.00 | 0.01 | 0.00 | 0.19 | 0.14 |
| 0/1 is a Regular School | 0.96 | 0.88 | 0.96 | 0.94 | 0.96 | 0.94 | 0.96 | 0.97 | 0.93 | 0.94 | 0.81 | 0.60 | 0.78 | 0.60 | 0.98 | 0.82 | 0.91 | 0.80 | 0.86 | 0.88 | 0.99 | 0.99 | 0.90 | 0.91 | 1.00 | 1.00 | 0.97 | 0.87 | 0.76 | 0.77 |
| Locale | ||||||||||||||||||||||||||||||
| In a City | 0.13 | 0.28 | 0.13 | 0.08 | 0.31 | 0.47 | 0.19 | 0.10 | 0.08 | 0.11 | 0.46 | 0.41 | 0.44 | 0.41 | 0.18 | 0.22 | 0.36 | 0.20 | 0.16 | 0.20 | 0.13 | 0.06 | 0.15 | 0.20 | 0.08 | 0.07 | 0.12 | 0.23 | 0.15 | 0.13 |
| In a Suburb | 0.16 | 0.19 | 0.78 | 0.76 | 0.62 | 0.12 | 0.19 | 0.06 | 0.08 | 0.04 | 0.47 | 0.36 | 0.50 | 0.36 | 0.43 | 0.18 | 0.31 | 0.11 | 0.42 | 0.27 | 0.07 | 0.01 | 0.67 | 0.64 | 0.04 | 0.00 | 0.66 | 0.27 | 0.35 | 0.20 |
| In a Town | 0.17 | 0.11 | 0.01 | 0.04 | 0.02 | 0.10 | 0.14 | 0.13 | 0.33 | 0.07 | 0.04 | 0.10 | 0.03 | 0.11 | 0.14 | 0.17 | 0.15 | 0.11 | 0.17 | 0.16 | 0.26 | 0.10 | 0.02 | 0.04 | 0.17 | 0.07 | 0.11 | 0.14 | 0.13 | 0.14 |
| In a Rural Area | 0.54 | 0.41 | 0.08 | 0.12 | 0.05 | 0.31 | 0.49 | 0.72 | 0.51 | 0.78 | 0.03 | 0.13 | 0.03 | 0.13 | 0.25 | 0.42 | 0.18 | 0.59 | 0.25 | 0.36 | 0.54 | 0.83 | 0.16 | 0.12 | 0.71 | 0.87 | 0.10 | 0.36 | 0.37 | 0.52 |
Cross-university results, in-state visits
Regression: probability of in-state public high school receiving a visit
| NC State | Rutgers | Stony Brook | Alabama | Arkansas | UC Berkeley | UC Irvine | Cincinnati | CU Boulder | Georgia | Kansas | UMass | Nebraska | Pittsburgh | S.Carolina | |
|---|---|---|---|---|---|---|---|---|---|---|---|---|---|---|---|
| Income (ref=<$50k) | |||||||||||||||
| $50k-$74k | -0.131** (0.042) | -0.153 (0.106) | -0.025 (0.021) | -0.043 (0.057) | 0.038 (0.078) | 0.079*** (0.021) | -0.056* (0.024) | 0.090* (0.035) | 0.147* (0.060) | -0.058 (0.062) | 0.079 (0.070) | 0.181 (0.103) | -0.020 (0.076) | 0.007 (0.034) | 0.019 (0.076) |
| $75k-$99k | 0.081 (0.102) | -0.140 (0.114) | -0.023 (0.035) | 0.016 (0.117) | 0.144 (0.274) | 0.114*** (0.029) | -0.059* (0.030) | 0.319*** (0.051) | 0.164* (0.077) | -0.010 (0.115) | 0.254*** (0.073) | 0.114 (0.111) | -0.115 (0.107) | 0.203*** (0.056) | 0.177 (0.125) |
| $100k-$149k | -0.145 (0.135) | -0.067 (0.121) | 0.112*** (0.031) | 0.097* (0.042) | -0.092* (0.041) | 0.419*** (0.064) | 0.129 (0.085) | 0.096 (0.133) | 0.264** (0.093) | 0.206 (0.112) | -0.049 (0.104) | 0.323*** (0.074) | 0.270 (0.142) | ||
| $150k-$199k | 0.131 (0.146) | 0.347*** (0.087) | 0.352*** (0.097) | -0.251*** (0.062) | 0.431*** (0.118) | 0.288* (0.141) | 0.422*** (0.126) | ||||||||
| $200k+ | 0.192 (0.156) | -0.009 (0.175) | -0.099 (0.131) | -0.292*** (0.056) | -0.625*** (0.137) | ||||||||||
| BL, LX, NA Enrollment (ref=<20%) | |||||||||||||||
| 20-39% | -0.157** (0.059) | 0.079 (0.072) | 0.165*** (0.038) | -0.046 (0.061) | -0.157 (0.084) | 0.005 (0.044) | 0.020 (0.032) | 0.089 (0.058) | -0.021 (0.052) | 0.045 (0.078) | 0.016 (0.070) | 0.024 (0.085) | 0.052 (0.056) | 0.034 (0.062) | 0.227* (0.104) |
| 40-59% | -0.064 (0.073) | 0.189* (0.093) | 0.143* (0.055) | -0.089 (0.084) | -0.123 (0.110) | 0.069 (0.046) | 0.087* (0.034) | 0.054 (0.072) | 0.051 (0.076) | 0.062 (0.083) | -0.009 (0.107) | 0.033 (0.119) | -0.172 (0.133) | -0.043 (0.073) | -0.002 (0.103) |
| 60-79% | -0.068 (0.077) | 0.252** (0.087) | 0.063 (0.061) | 0.078 (0.103) | -0.041 (0.191) | 0.046 (0.046) | 0.118** (0.038) | 0.016 (0.082) | -0.032 (0.079) | 0.132 (0.098) | -0.003 (0.116) | 0.053 (0.132) | -0.136 (0.200) | -0.179* (0.085) | -0.012 (0.130) |
| 80-89% | -0.117 (0.107) | 0.073 (0.154) | -0.009 (0.060) | 0.051 (0.131) | -0.320 (0.171) | 0.069 (0.049) | 0.124** (0.047) | 0.035 (0.079) | 0.130 (0.108) | -0.070 (0.111) | 0.132 (0.097) | -0.088 (0.146) | -0.272 (0.144) | -0.107 (0.082) | 0.230 (0.130) |
| 90%+ | -0.108 (0.086) | 0.100 (0.113) | -0.116* (0.055) | -0.241*** (0.065) | -0.136 (0.168) | 0.166*** (0.049) | 0.192*** (0.043) | 0.244*** (0.074) | -0.054 (0.103) | 0.250* (0.103) | -0.172 (0.152) | -0.217 (0.298) | 0.003 (0.067) | -0.102 (0.119) | |
| # Math Proficient Students (ref=<50) | |||||||||||||||
| 50-99 | 0.006 (0.061) | 0.112 (0.067) | 0.043* (0.018) | 0.093 (0.100) | 0.222 (0.122) | 0.006 (0.032) | 0.045 (0.036) | 0.106* (0.053) | 0.118 (0.072) | 0.153 (0.079) | -0.068 (0.049) | 0.171 (0.102) | 0.064 (0.069) | 0.006 (0.037) | -0.150 (0.134) |
| 100-199 | 0.071 (0.093) | 0.156* (0.077) | 0.134*** (0.039) | 0.382** (0.119) | -0.004 (0.196) | 0.081 (0.042) | 0.037 (0.045) | 0.066 (0.071) | 0.153* (0.065) | 0.278** (0.098) | -0.179* (0.071) | 0.317* (0.138) | 0.001 (0.111) | 0.213*** (0.056) | -0.340 (0.228) |
| 200-299 | 0.097 (0.148) | 0.308*** (0.085) | 0.182* (0.089) | 0.243 (0.169) | 0.354 (0.199) | 0.129* (0.059) | 0.125* (0.062) | -0.024 (0.108) | 0.097 (0.087) | 0.319* (0.141) | -0.236* (0.095) | 0.335 (0.179) | 0.001 (0.173) | 0.369*** (0.089) | -0.395 (0.261) |
| 300-399 | 0.017 (0.197) | 0.230 (0.179) | 0.357** (0.116) | 0.126 (0.300) | 0.049 (0.088) | 0.172 (0.093) | -0.060 (0.130) | 0.093 (0.075) | 0.489** (0.182) | 0.528* (0.212) | -0.096 (0.184) | 0.487*** (0.131) | -0.522 (0.305) | ||
| 400+ | 0.611 (0.391) | 0.410*** (0.124) | 0.599*** (0.157) | 0.367 (0.343) | 0.109 (0.140) | 0.231 (0.124) | -0.099 (0.135) | 0.088 (0.072) | 0.352 (0.220) | 0.618* (0.251) | -0.135 (0.227) | 0.548** (0.177) | -0.849* (0.374) | ||
| # G12 Students (ref=<50) | |||||||||||||||
| 50-99 | 0.189** (0.058) | 0.087 (0.119) | -0.029 (0.019) | 0.165** (0.056) | 0.218** (0.080) | -0.014 (0.019) | -0.009 (0.019) | 0.115* (0.050) | 0.290*** (0.080) | 0.207** (0.077) | 0.163 (0.084) | 0.150 (0.117) | 0.107 (0.087) | 0.058 (0.035) | 0.279* (0.132) |
| 100-199 | 0.308*** (0.057) | 0.229* (0.113) | -0.045 (0.035) | 0.272*** (0.064) | 0.252* (0.116) | 0.015 (0.021) | -0.009 (0.022) | 0.336*** (0.071) | 0.436*** (0.098) | 0.191** (0.072) | 0.391*** (0.071) | 0.059 (0.135) | 0.217 (0.118) | 0.068 (0.047) | 0.774*** (0.213) |
| 200-299 | 0.328*** (0.080) | 0.240* (0.122) | 0.022 (0.080) | 0.686*** (0.104) | 0.325 (0.166) | 0.083** (0.032) | 0.046 (0.033) | 0.460*** (0.097) | 0.534*** (0.100) | 0.293*** (0.088) | 0.461*** (0.081) | -0.043 (0.163) | 0.391* (0.168) | 0.110 (0.068) | 1.011*** (0.239) |
| 300-399 | 0.398*** (0.105) | 0.291* (0.119) | -0.083 (0.103) | 0.435*** (0.131) | 0.180*** (0.039) | 0.121** (0.042) | 0.611*** (0.119) | 0.554*** (0.092) | 0.401*** (0.104) | 0.554*** (0.088) | 0.061 (0.191) | 0.409* (0.190) | 0.142 (0.091) | 1.025*** (0.272) | |
| 400-499 | 0.277 (0.143) | 0.243 (0.136) | -0.279 (0.150) | 0.480** (0.168) | 0.635** (0.195) | 0.120** (0.041) | 0.112* (0.044) | 0.717*** (0.128) | 0.552*** (0.099) | 0.369** (0.130) | 0.597*** (0.098) | 0.050 (0.219) | 0.451* (0.186) | 0.105 (0.140) | 1.336*** (0.299) |
| 500+ | 0.299 (0.207) | 0.276 (0.143) | -0.129 (0.168) | 0.760*** (0.168) | 0.602* (0.273) | 0.195*** (0.041) | 0.185*** (0.046) | 0.455** (0.163) | 0.498*** (0.115) | 0.265 (0.146) | 0.665*** (0.129) | -0.117 (0.320) | 0.589* (0.233) | 0.268 (0.166) | 1.674*** (0.383) |
| Locale (ref=suburb) | |||||||||||||||
| City | -0.070 (0.063) | 0.122 (0.097) | -0.218*** (0.049) | -0.209* (0.095) | -0.301 (0.193) | 0.006 (0.022) | -0.037 (0.024) | 0.023 (0.059) | 0.087 (0.061) | -0.058 (0.075) | 0.075 (0.069) | 0.033 (0.085) | -0.020 (0.071) | 0.049 (0.056) | 0.055 (0.092) |
| Rural | 0.114* (0.056) | -0.125 (0.081) | -0.090* (0.039) | -0.163 (0.093) | -0.044 (0.174) | -0.041 (0.029) | -0.072* (0.031) | -0.129** (0.044) | -0.130 (0.072) | -0.008 (0.071) | 0.142* (0.067) | 0.034 (0.080) | 0.273* (0.126) | -0.173*** (0.045) | 0.007 (0.087) |
| Town | 0.162* (0.073) | -0.205 (0.151) | -0.119** (0.039) | -0.213* (0.105) | 0.233 (0.165) | -0.042 (0.032) | -0.083** (0.032) | -0.027 (0.050) | 0.036 (0.091) | 0.124 (0.087) | 0.229** (0.074) | -0.130 (0.182) | 0.214 (0.128) | -0.036 (0.058) | -0.009 (0.116) |
| School Type (ref=regular school) | |||||||||||||||
| Charter | -0.071 (0.069) | -0.063 (0.122) | 0.051 (0.034) | 0.250 (0.161) | -0.047* (0.020) | -0.071** (0.024) | -0.180*** (0.052) | -0.169 (0.094) | 0.135 (0.116) | -0.401*** (0.114) | 0.217* (0.094) | -0.072 (0.046) | 0.196 (0.130) | ||
| Magnet | -0.055 (0.092) | 0.217** (0.072) | 0.099 (0.129) | 0.042 (0.292) | -0.008 (0.036) | -0.006 (0.040) | 0.354 (0.197) | 0.024 (0.090) | 0.141 (0.140) | 0.376 (0.255) | 0.048 (0.089) | ||||
| Distance (in 10 miles) | -0.010** (0.004) | -0.006 (0.014) | -0.016*** (0.001) | -0.004 (0.005) | 0.004 (0.006) | -0.007*** (0.001) | -0.0001 (0.001) | -0.018*** (0.002) | -0.002 (0.005) | -0.002 (0.005) | -0.005 (0.003) | -0.013 (0.010) | -0.005 (0.003) | -0.013*** (0.002) | -0.036*** (0.009) |
| Constant | 0.195 (0.100) | 0.352 (0.181) | 0.423*** (0.045) | 0.314** (0.117) | 0.336 (0.193) | 0.092 (0.052) | 0.062 (0.053) | 0.343*** (0.065) | 0.183 (0.107) | -0.067 (0.125) | 0.349*** (0.099) | 0.227 (0.157) | 0.657*** (0.164) | 0.276*** (0.058) | 0.282 (0.158) |
| Observations | 504 | 400 | 1,156 | 341 | 237 | 1,404 | 1,404 | 817 | 313 | 418 | 317 | 348 | 247 | 652 | 209 |
| Akaike Inf. Crit. | 575.111 | 541.538 | 309.406 | 364.784 | 328.378 | 994.316 | 1,033.760 | 798.974 | 252.223 | 563.412 | 373.616 | 475.712 | 166.755 | 480.002 | 250.649 |
*p<0.05; **p<0.01; ***p<0.001; Dependent Variable: Received a recruiting visit (0/1); Robust standard errors in parentheses; Schools that satisfied the following criteria were included in the sample: offers grades 9-12 and enrolls at least ten student in each grade; located in the 50 U.S. states, the District of Columbia, or land regulated by the Bureau of Indian Affairs; is not special education school, an alternative school, or a virtual school.
Cross-university results, in-state visits
Descriptive statistics for community college visits
| NC State | Rutgers | Stony Brook | Alabama | Arkansas | UC Berkeley | UC Irvine | Cincinnati | CU Boulder | Georgia | Kansas | UMass | Nebraska | Pittsburgh | S.Carolina | ||||||||||||||||
|---|---|---|---|---|---|---|---|---|---|---|---|---|---|---|---|---|---|---|---|---|---|---|---|---|---|---|---|---|---|---|
| Visit | Nonvisit | Visit | Nonvisit | Visit | Nonvisit | Visit | Nonvisit | Visit | Nonvisit | Visit | Nonvisit | Visit | Nonvisit | Visit | Nonvisit | Visit | Nonvisit | Visit | Nonvisit | Visit | Nonvisit | Visit | Nonvisit | Visit | Nonvisit | Visit | Nonvisit | Visit | Nonvisit | |
| Number of Colleges | 43 | 17 | 18 | 6 | 10 | 61 | 23 | 3 | 14 | 10 | 93 | 34 | 98 | 29 | 15 | 60 | 14 | 3 | 1 | 26 | 15 | 11 | 15 | 13 | 6 | 2 | 10 | 39 | 2 | 19 |
| Percent of Colleges | 71.7 | 28.3 | 75.0 | 25.0 | 14.1 | 85.9 | 88.5 | 11.5 | 58.3 | 41.7 | 73.2 | 26.8 | 77.2 | 22.8 | 20.0 | 80.0 | 82.4 | 17.6 | 3.7 | 96.3 | 57.7 | 42.3 | 53.6 | 46.4 | 75.0 | 25.0 | 20.4 | 79.6 | 9.5 | 90.5 |
| Miles from University | 111 | 97 | 38 | 27 | 44 | 175 | 104 | 119 | 148 | 149 | 240 | 230 | 190 | 223 | 155 | 149 | 94 | 76 | 34 | 112 | 160 | 135 | 59 | 63 | 136 | 146 | 144 | 137 | 71 | 70 |
| Enrollment by FTE | 3,403 | 2,150 | 6,463 | 364 | 12,415 | 1,931 | 2,664 | 960 | 1,546 | 1,468 | 8,658 | 3,374 | 8,810 | 1,950 | 4,728 | 873 | 4,119 | 1,348 | 2,532 | 3,754 | 2,953 | 1,055 | 4,087 | 312 | 4,654 | 189 | 6,298 | 820 | 2,519 | 3,378 |
| Median Household Income ($000) | $44 | $42 | $84 | $87 | $93 | $57 | $36 | $50 | $39 | $38 | $73 | $58 | $73 | $57 | $43 | $50 | $49 | $43 | $50 | $38 | $47 | $49 | $68 | $79 | $41 | $37 | $67 | $55 | $35 | $37 |
| Percent Pell | 62.7 | 68.0 | 52.3 | 48.0 | 59.2 | 64.2 | 64.9 | 50.7 | 71.1 | 76.1 | 49.7 | 57.5 | 49.9 | 58.4 | 60.8 | 64.8 | 54.9 | 31.7 | 61.0 | 76.1 | 49.6 | 57.5 | 57.9 | 53.9 | 51.2 | 63.5 | 47.9 | 64.7 | 70.0 | 66.1 |
| Percent Enrollment by Race | ||||||||||||||||||||||||||||||
| Black, Latinx, Native American | 29.5 | 30.0 | 40.2 | 34.0 | 51.9 | 27.4 | 35.9 | 54.6 | 25.2 | 35.7 | 53.4 | 53.3 | 53.6 | 52.4 | 16.4 | 13.1 | 29.0 | 39.0 | 22.9 | 41.5 | 27.9 | 24.0 | 32.6 | 23.5 | 19.3 | 51.1 | 17.4 | 13.7 | 45.6 | 41.0 |
| White | 61.8 | 57.4 | 43.8 | 56.8 | 32.8 | 60.4 | 59.0 | 41.6 | 70.8 | 57.2 | 23.2 | 28.6 | 22.9 | 30.4 | 73.9 | 82.2 | 56.2 | 37.3 | 71.5 | 47.1 | 61.0 | 62.0 | 55.5 | 67.2 | 69.5 | 45.6 | 67.3 | 81.0 | 45.3 | 52.0 |
| Black | 18.6 | 23.7 | 15.2 | 13.6 | 19.0 | 17.4 | 31.2 | 50.6 | 17.6 | 27.7 | 6.0 | 7.7 | 5.9 | 8.3 | 10.6 | 11.1 | 6.1 | 6.3 | 7.1 | 39.6 | 11.9 | 10.0 | 12.8 | 21.1 | 4.2 | 0.0 | 10.3 | 9.0 | 41.7 | 36.3 |
| Latinx | 8.6 | 6.1 | 24.5 | 20.2 | 32.5 | 11.3 | 3.8 | 2.6 | 7.0 | 6.9 | 46.9 | 48.4 | 47.3 | 47.2 | 5.3 | 2.2 | 21.7 | 31.4 | 15.2 | 6.9 | 14.3 | 12.8 | 19.5 | 4.3 | 14.4 | 3.9 | 6.5 | 5.3 | 3.2 | 4.2 |
| Native American | 2.3 | 2.0 | 0.4 | 0.1 | 0.4 | 0.6 | 0.9 | 1.3 | 0.6 | 1.1 | 0.5 | 0.6 | 0.4 | 0.8 | 0.5 | 0.2 | 1.3 | 1.3 | 0.6 | 0.4 | 1.7 | 1.2 | 0.4 | 0.0 | 0.8 | 47.2 | 0.6 | 0.1 | 0.8 | 0.5 |
| Asian | 1.6 | 1.2 | 4.5 | 3.3 | 8.4 | 1.4 | 1.0 | 0.2 | 0.5 | 1.0 | 11.7 | 6.2 | 11.8 | 4.7 | 0.8 | 0.8 | 1.6 | 2.3 | 1.2 | 1.8 | 1.5 | 1.3 | 3.9 | 1.6 | 1.4 | 0.0 | 2.1 | 1.2 | 1.2 | 1.0 |
| Other Race | 6.1 | 7.9 | 9.5 | 6.0 | 4.3 | 7.4 | 3.5 | 3.2 | 3.1 | 5.7 | 6.2 | 6.0 | 6.2 | 6.1 | 7.9 | 3.2 | 8.7 | 20.4 | 2.5 | 2.8 | 6.7 | 10.2 | 5.8 | 4.3 | 6.5 | 3.3 | 12.5 | 2.9 | 6.8 | 5.8 |
| Locale | ||||||||||||||||||||||||||||||
| In a City | 0.23 | 0.18 | 0.11 | 0.00 | 0.40 | 0.16 | 0.30 | 0.33 | 0.07 | 0.30 | 0.44 | 0.35 | 0.47 | 0.24 | 0.33 | 0.12 | 0.36 | 0.67 | 0.00 | 0.35 | 0.13 | 0.18 | 0.33 | 0.00 | 0.50 | 0.00 | 0.20 | 0.13 | 0.00 | 0.32 |
| In a Suburb | 0.16 | 0.12 | 0.44 | 0.83 | 0.60 | 0.34 | 0.00 | 0.33 | 0.07 | 0.10 | 0.44 | 0.38 | 0.44 | 0.38 | 0.13 | 0.27 | 0.21 | 0.00 | 1.00 | 0.23 | 0.00 | 0.00 | 0.47 | 0.92 | 0.00 | 0.00 | 0.50 | 0.36 | 0.50 | 0.16 |
| In a Town | 0.28 | 0.24 | 0.06 | 0.00 | 0.00 | 0.16 | 0.35 | 0.00 | 0.50 | 0.40 | 0.02 | 0.12 | 0.01 | 0.17 | 0.20 | 0.22 | 0.36 | 0.00 | 0.00 | 0.23 | 0.60 | 0.64 | 0.07 | 0.00 | 0.50 | 0.00 | 0.10 | 0.21 | 0.00 | 0.26 |
| In a Rural Area | 0.33 | 0.47 | 0.39 | 0.17 | 0.00 | 0.33 | 0.35 | 0.33 | 0.36 | 0.20 | 0.10 | 0.15 | 0.08 | 0.21 | 0.33 | 0.40 | 0.07 | 0.33 | 0.00 | 0.19 | 0.27 | 0.18 | 0.13 | 0.08 | 0.00 | 1.00 | 0.20 | 0.31 | 0.50 | 0.26 |
We define community college as any public, 2-year or public, less-than 2-year institution, which could be a campus of a Title IV institution.
Summary
Summary of results
Out of State Recruiting
- Majority of visits are out-of-state (exceptions: NC State, UC Irvine, UC Berkeley)
- Big income bias; visits concentrated in highly affluent communities, in metropolitan areas
- Big racial bias; less likely to visit schools with predominantly Black/Hispanic/Native students
- Disproportionate number of visits to private high schools
In-State Recruiting
- Variation in coverage of public high schools (e.g., Nebraska=88%; Alabama=33%), community colleges
- Visits largely driven by either achievement or enrollment size
- Income bias in most cases (but less than out-of-state) even after controlling for "rational" reasons
- Exceptions: NC State, UC Irvine
- Bias against schools with predominantly Black/Hispanic/Native in some cases (e.g., U. Alabama)
Overall similarities and differences
- For most cases, limited in-state recruiting and expansive out-of-state recruiting in big metro areas
- But differences in which metro areas, regions of country visited
- Universities with higher state funding: fewer out-of-state visits; better, equitable coverage of in-state
Discussion
Next steps, implications, future research
Next steps for this paper
- Complete cross-case holistic analysis of recruiting; develop recruiting "types"
Implications
- Results suggest dramatic income bias in enrollment priorities of public research universities
- Evidence of racial bias (especially in out-of-state recruiting), but patterns more nuanced
- Policy discourse should focus on enrollment priorities, rather than student, K-12 deficiencies
- "Under-matching" may be a function of under-recruiting
Future research
- Manuscript that focuses on racial biases in off-campus recruiting visits
- Universities prioritizing middle-class students of color and "privileged poor" (Jack, 2016) enrolled in high-resource schools, but ignoring traditional public schools that are majority-minority?
- Collect/analyze data on other means used to identify and target prospects
- Characteristics universities prioritize when purchasing "prospect lists" from College Board/ACT?
- Experimental audits of university responses to "inquiries" with different characteristics
Acknowledgments
This research was made possible by funding from the following sources:
- National Academy of Education/Spencer Foundation (Postdoctoral Fellowship)
- American Educational Research Association (Dissertation Grant)
- UCLA Office of Equity, Diversity, and Inclusion (Faculty Career Development Award)
- Joyce Foundation (Research Grant)
References
[1] G. F. Davis. “Firms and environments”. In: The handbook of economic sociology. Ed. by N. J. Smelser and R. Swedberg. New York: Russell Sage Foundation, 2005, pp. 478-502. ISBN: 0691034486 (alk. paper).
[2] S. Dynarski, C. J. Libassi, K. Michelmore, et al. “Closing the Gap: The Effect of a Targeted, Tuition-Free Promise on College Choices of High-Achieving, Low-Income Students”. In: National Bureau of Economic Research Working Paper Series No. 25349 (2018). DOI: 10.3386/w25349. URL: http://www.nber.org/papers/w25349.
[3] K. M. Eisenhardt. “Building theories from case study research”. In: Academy of Management Review 14.4 (1989), pp. 532-550. ISSN: 0363-7425.
[4] A. Hanson. “Do college admissions counselors discriminate? Evidence from a correspondence-based field experiment”. In: Economics of Education Review 60 (2017), pp. 86-96. ISSN: 0272-7757. DOI: https://doi.org/10.1016/j.econedurev.2017.08.004. URL: http://www.sciencedirect.com/science/article/pii/S0272775716304526.
[5] M. M. Holland. Divergent pathways to college: Race, class, and inequality in high schools. New Brunswick, NJ: Rutgers University Press, 2019.
[6] A. A. Jack. “(No) harm in asking: Class, acquired cultural capital, and academic engagement at an elite university”. In: Sociology of Education 89.1 (2016), pp. 1-19. DOI: 10.1177/0038040715614913. URL: https://journals.sagepub.com/doi/abs/10.1177/0038040715614913.
[7] H. Korzilius. “Quantitative Analysis in Case Study”. In: Encyclopedia of case study research. Ed. by A. J. Mills, G. Durepos and E. Wiebe. Thousand Oaks: SAGE Publications, Inc., 2010, pp. 760-764.
[8] J. W. Meyer and B. Rowan. “Institutionalized organizations: formal structure as myth and ceremony”. In: The American Journal of Sociology 83.2 (1977), pp. 340-363.
[9] R. Noel-Levitz. 2018 marketing and student recruitment report of effective practices. Tech. rep. Ruffalo Noel-Levitz, 2018. URL: http://learn.ruffalonl.com/rs/395-EOG-977/images/RNL_2018_Student_Recruitment_Marketing_Report_EM-19.pdf.
[10] M. Q. Patton. Qualitative research and evaluation methods. Thousand Oaks, Calif.: Sage, 2002. ISBN: 0761919716 9780761919711.
[11] J. Pfeffer and G. R. Salancik. The external control of organizations: A resource dependence perspective. New York: Harper and Row, 1978, p. xiii, 300 p. ISBN: 0060451939.
[12] M. G. Pratt, K. W. Rockmann and J. B. Kaufmann. “Constructing professional identity: The role of work and identity learning cycles in the customization of identity among medical residents”. In: Academy of Management Journal 49.2 (2006), pp. 235-262. ISSN: 0001-4273. DOI: 10.5465/amj.2006.20786060. URL: <Go to ISI>://WOS:000237198600007.
[13] M. L. Stevens. Creating a class: College admissions and the education of elites. Cambridge, MA: Harvard University Press, 2007, p. 308 p. ISBN: 9780674026735 (alk. paper) 067402673X (alk. paper).
[14] The White House. Commitments to action on college opportunity. Tech. rep. The Executive Office of the President, 2014.
[15] The White House. Increasing college opportunity for low-income students. Tech. rep. The Executive Office of the President, 2014.
[16] J. Thompson. Organizations in action. New York: McGraw Hill, 1967.
[17] T. Thornhill. “We Want Black Students, Just Not You: How White Admissions Counselors Screen Black Prospective Students”. In: Sociology of Race and Ethnicity 0.0 (). DOI: 10.1177/2332649218792579. URL: https://journals.sagepub.com/doi/abs/10.1177/2332649218792579.