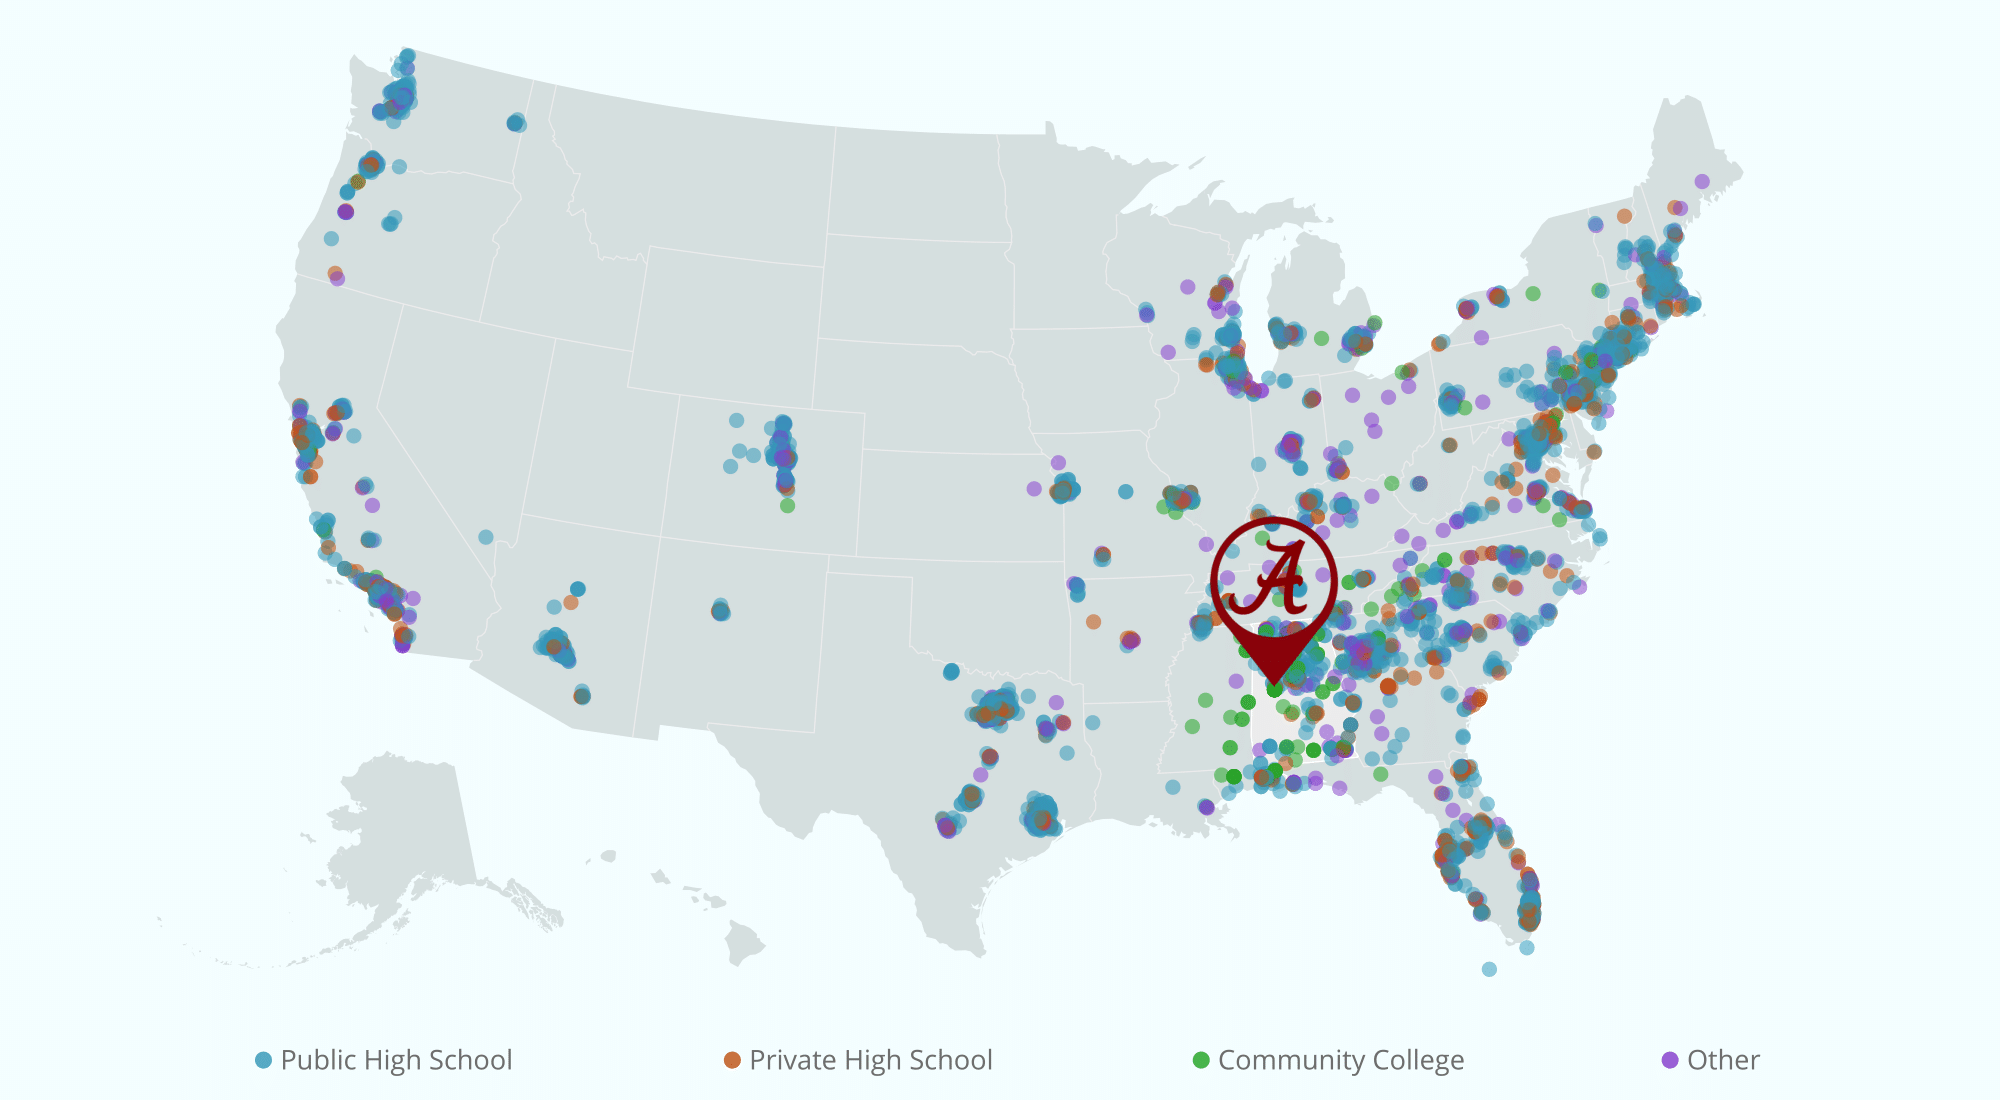
Recruiting the Out-of-State University
Off-Campus Recruiting by Public Research Universities
March 2019
Prepared for:
![]()
* These slides only contain interactive results to supplement the report. For full report, please see above link.
Analysis Sample
Median Characteristics of Study Sample versus Population of Public Institutions
| Sample (N = 17) | Population (N = 80) | |
|---|---|---|
| Academic Profile | ||
| US News & World Report Ranking | 92 | 94 |
| 25th Percentile SAT/ACT Composite Score | 1,126 | 1,085 |
| 75th Percentile SAT/ACT Composite Score | 1,334 | 1,300 |
| Enrollment | ||
| Total Enrolled Freshmen | 5,433 | 4,957 |
| Percent Out-of-State Freshmen | 26.5% | 25.4% |
| Percent Pell Recipients | 21.5% | 24.0% |
| Tuition and Fees | ||
| In-State Tuition + Fees | $11,785 | $11,026 |
| Out-of-State Tuition + Fees | $30,502 | $29,441 |
| Revenues | ||
| Total Net Tuition Revenue | $463,142,400 | $379,065,984 |
| Percent of Total Revenue from Tuition | 25.5% | 26.3% |
| Total State Appropriations | $286,740,832 | $267,926,000 |
| Appropriation per Student | $9,982 | $7,903 |
| Percent of Total Revenue from State Appropriations | 19.5% | 16.7% |
| Total State Revenue | $295,350,848 | $290,634,448 |
| Revenue per Student | $11,347 | $8,970 |
| Percent of Total Revenue from State (All Sources) | 21.1% | 19.4% |
Note: Author calculations based on 2016-2017 IPEDS. Population of universities includes universities categorized as Highest Research Activity by 2015 Carnegie Classification. The University of Alabama is the only institution in the study sample that is not classified as Highest Research Activity.
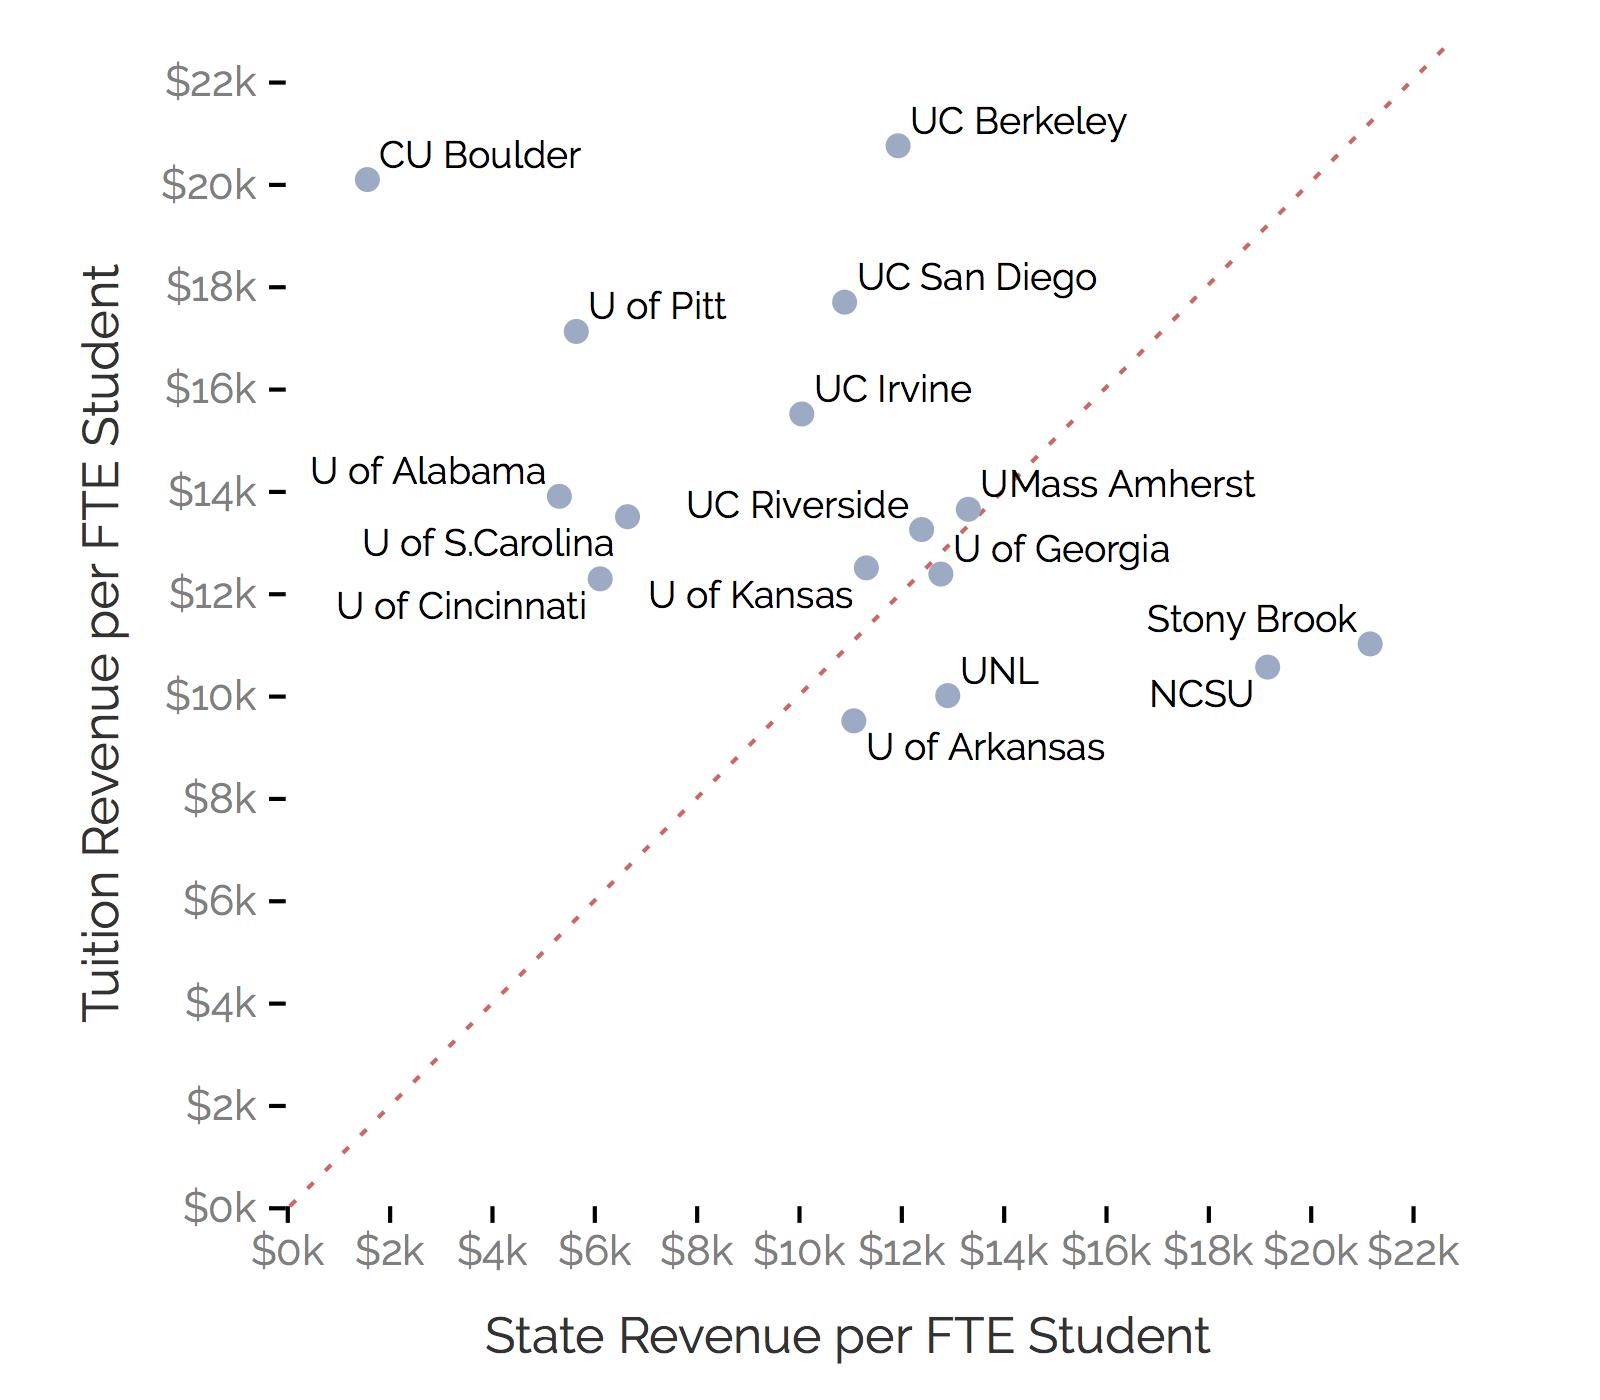
State and Institutional Context
State and Tuition Revenue per FTE Student for Sample Institutions in 2016-17
Data and Methods
Summary of Data Collection Sources and Quality Checks Performed
| NC State | Rutgers | Stony Brook | Alabama | Arkansas | UC Berkeley | UC Irvine | UC Riverside | UC San Diego | Cincinnati | CU Boulder | Georgia | Kansas | UMass | Nebraska | Pittsburgh | S.Carolina | |
|---|---|---|---|---|---|---|---|---|---|---|---|---|---|---|---|---|---|
| Web-scrape data collection | |||||||||||||||||
| Scraped data on off-campus recruiting events? | Y | Y | Y | Y | Y | Y | Y | Y | Y | Y | Y | Y | Y | Y | Y | Y | Y |
| Manually checked each scraped event? | Y | Y | Y | Y | Y | Y | Y | Y | Y | Y | Y | Y | Y | Y | Y | Y | Y |
| Public records request data collection | |||||||||||||||||
| Requested data from Enrollment Management VP from university? | Y | Y | Y | Y | Y | Y | Y | Y | Y | Y | Y | Y | Y | Y | Y | Y | Y |
| Received data from Enrollment Management VP? | N | N | N | N | N | N | N | Y | N | N | N | Y | N | N | N | N | N |
| State law allows nonresidents to request from public universities? | Y | N | Y | Ambiguous | N | Y | Y | Y | Y | Y | Y | N | Y | Y | Y | N | Y |
| Made public records request to university? | Y | Y | Y | Y | Y | Y | Y | N | Y | Y | Y | N | Y | Y | Y | Y | Y |
| Received public records data from university (by 10/1/2019)? | Y | Y | Y | N | N | Y | Y | - | Y | Y | Y | - | Y | Y | N | N | Y |
| Manually checked each visit from requested data? | N | Y | Y | - | - | Y | Y | Y | Y | Y | Y | Y | Y | Y | - | - | Y |
| Data used in report analyses | |||||||||||||||||
| Web-scrape data is primary data source? | Y | N | N | Y | Y | N | N | N | N | N | N | N | N | N | Y | Y | N |
| Public records data used as primary data source? | N | Y | Y | N | N | Y | Y | Y | Y | Y | Y | Y | Y | Y | N | N | Y |
Table of Contents
- National Overview
- In-State Results
- Out-of-State Results
National Overview
In-State Results
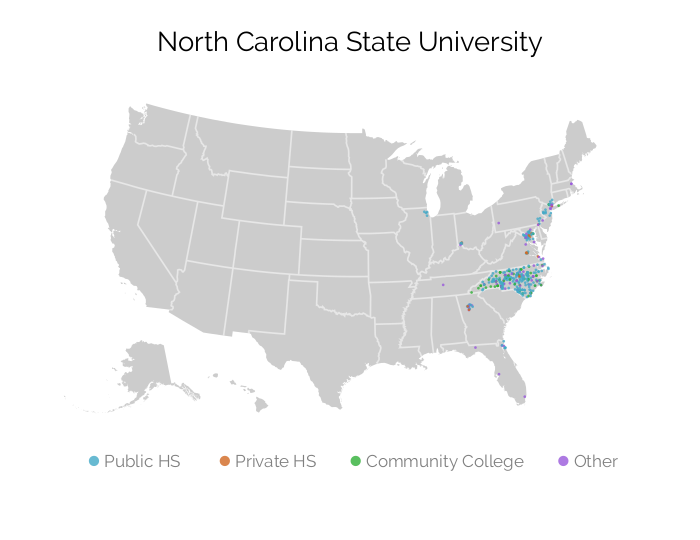
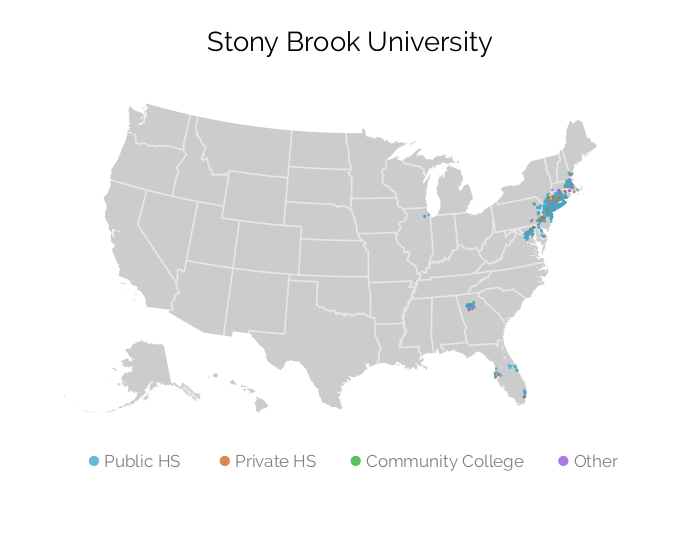
State Map
In-State Results
State Figures
In-State Results
Metro Area Map
In-State Results
Metro Area Figures
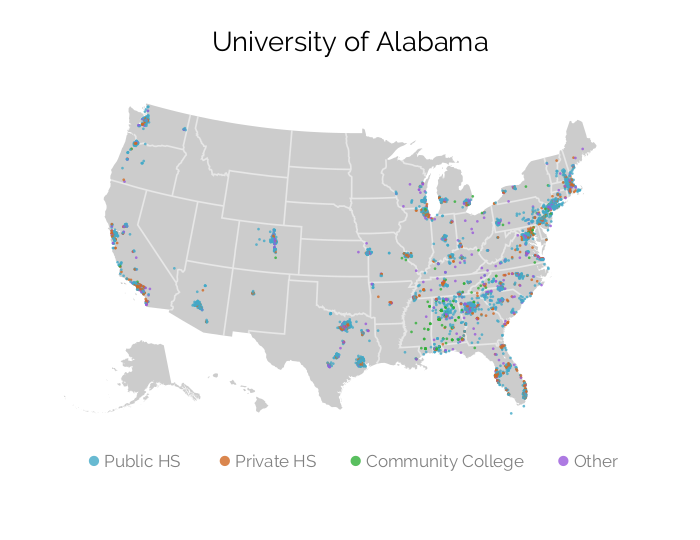
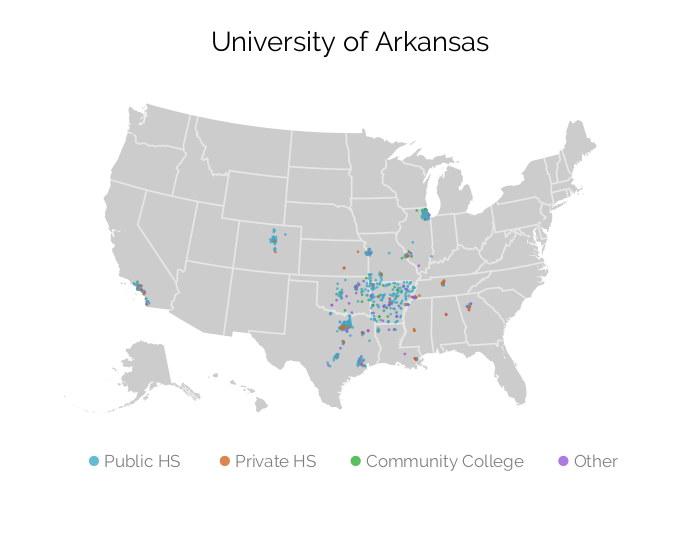
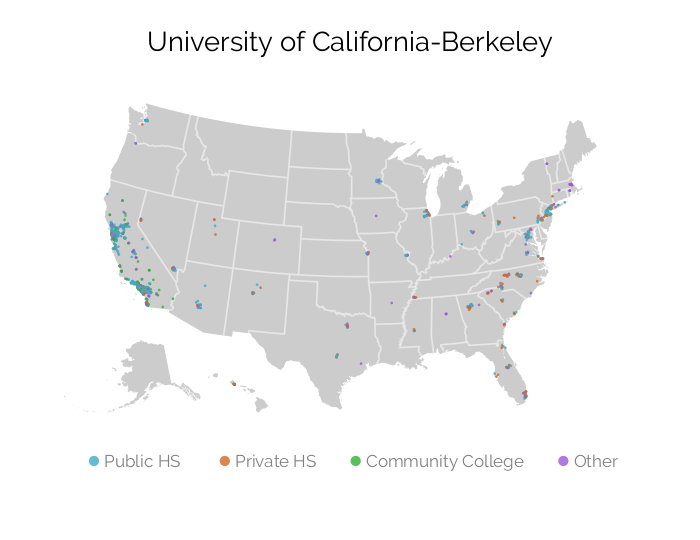
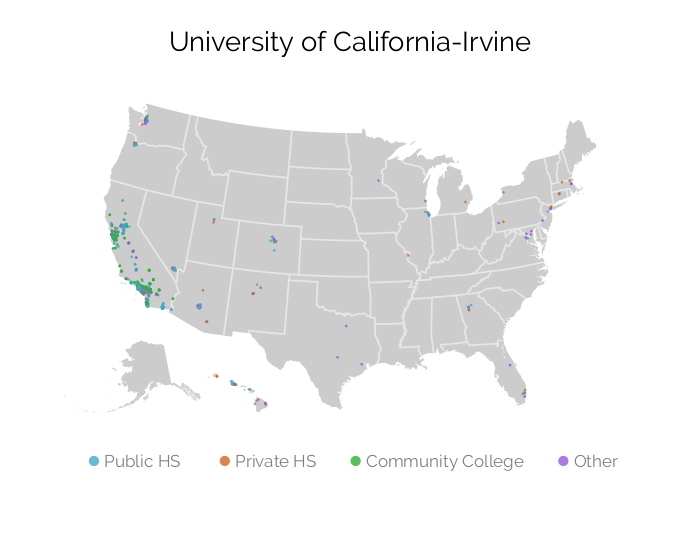
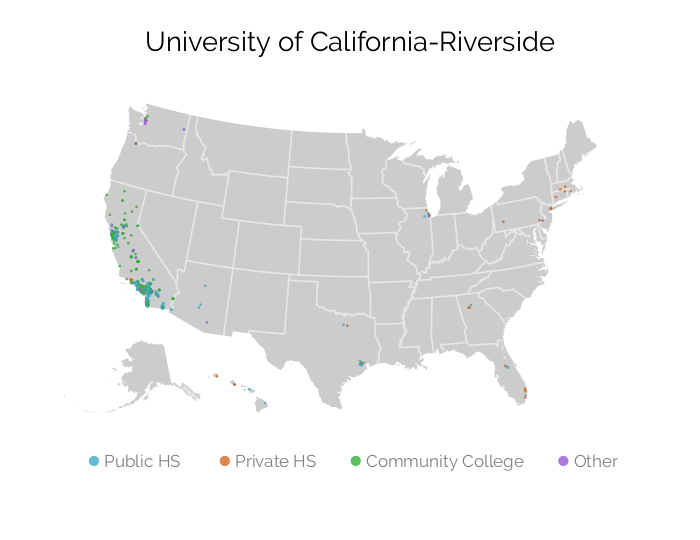
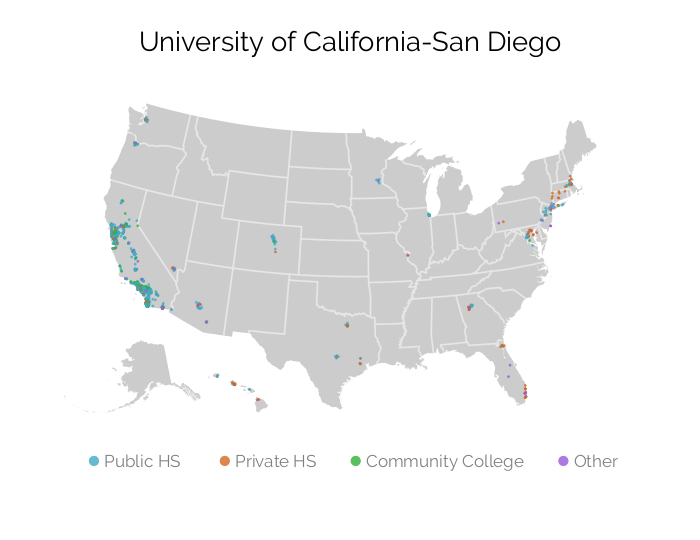
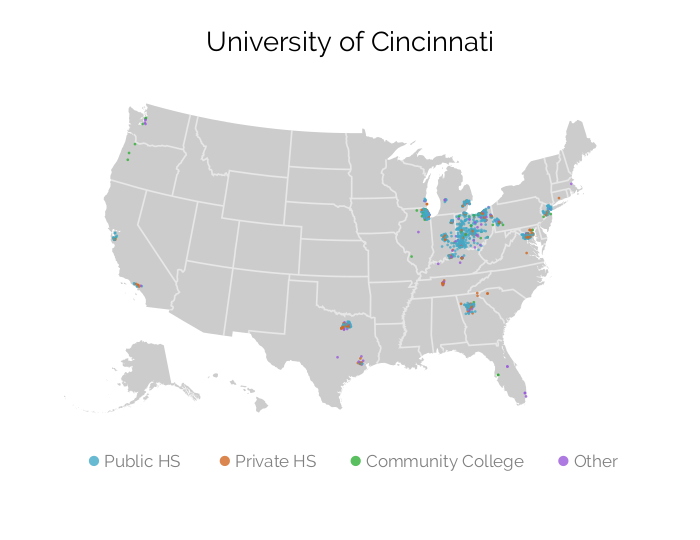
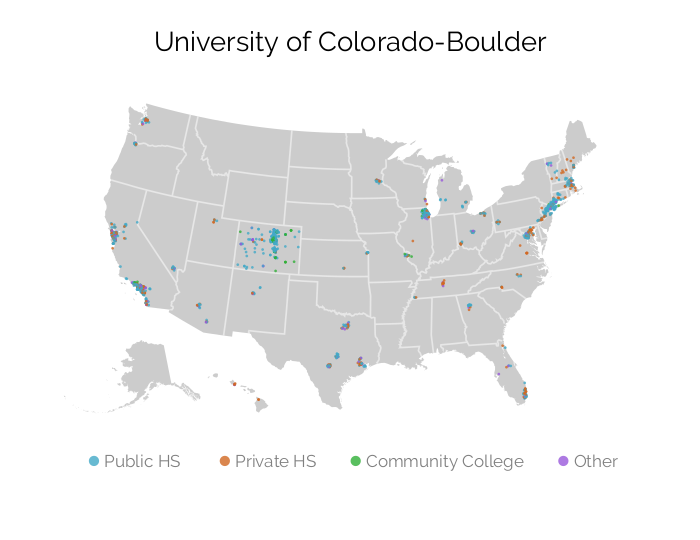
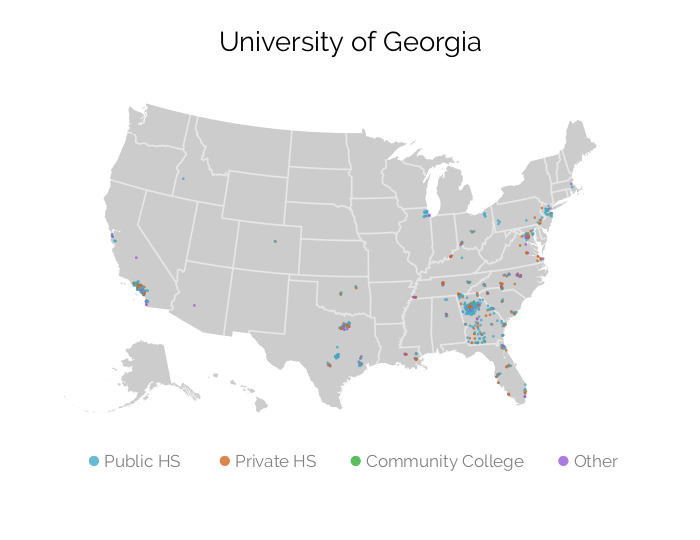
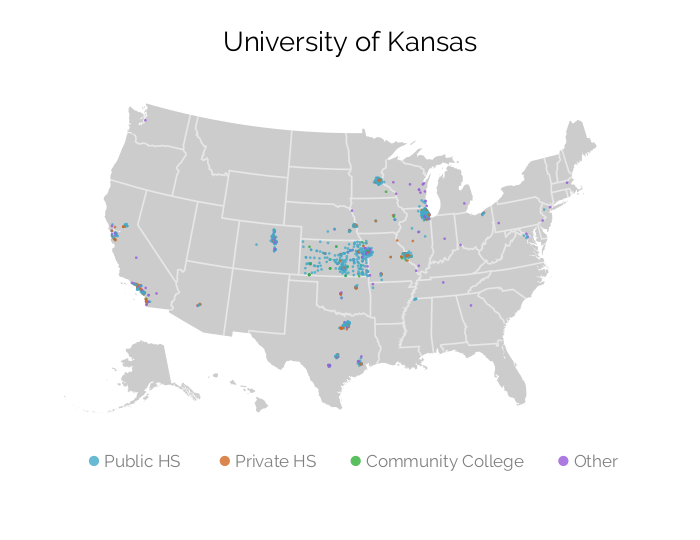
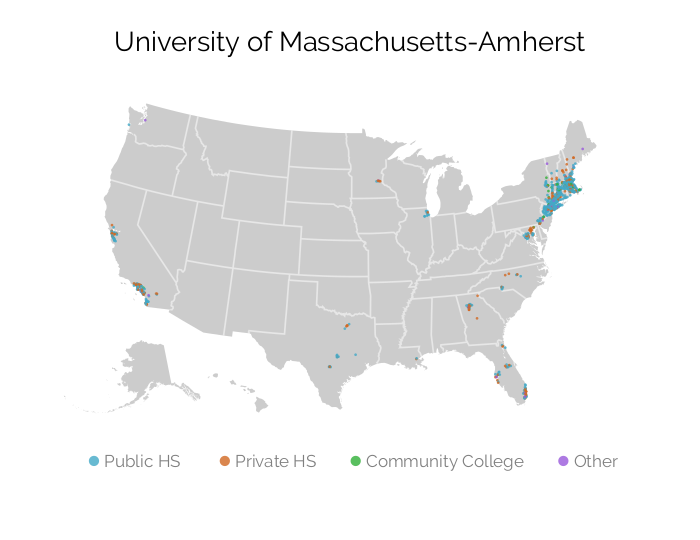
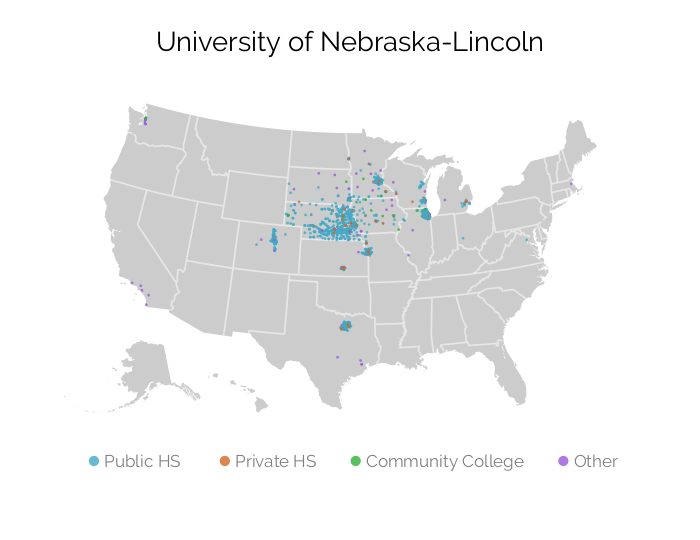
Out-of-State Results
Top Visited Metro Areas
Out-of-State Results
Out-of-State Results
Metro Area Map
Out-of-State Results
Metro Area Figures
Out-of-State Results
Metro Area Map
Out-of-State Results
Metro Area Figures
Cross-university results
Number of events by type and in-state, out-of-state
| Out-of-State | In-State | |||||||||||
|---|---|---|---|---|---|---|---|---|---|---|---|---|
| Total Events | Total | Pub HS | Priv HS | Other | Total | Pub HS | Priv HS | CC | Other | |||
| NC State | 371 | 124 | 72 | 20 | 32 | 247 | 157 | 3 | 55 | 32 | ||
| Rutgers | 1,623 | 948 | 554 | 231 | 163 | 675 | 477 | 72 | 89 | 37 | ||
| Stony Brook | 1,081 | 657 | 496 | 107 | 54 | 424 | 326 | 39 | 33 | 26 | ||
| Alabama | 4,282 | 3,900 | 2,310 | 931 | 659 | 382 | 156 | 54 | 124 | 48 | ||
| Arkansas | 1,013 | 788 | 483 | 204 | 101 | 225 | 162 | 21 | 16 | 26 | ||
| UC Berkeley | 1,126 | 471 | 212 | 162 | 97 | 655 | 343 | 46 | 161 | 105 | ||
| UC Irvine | 939 | 172 | 77 | 40 | 55 | 767 | 330 | 20 | 322 | 95 | ||
| UC Riverside | 1,066 | 72 | 21 | 32 | 19 | 994 | 477 | 55 | 399 | 63 | ||
| UC San Diego | 1,331 | 302 | 146 | 112 | 44 | 1,029 | 610 | 85 | 248 | 86 | ||
| Cincinnati | 1,369 | 815 | 491 | 204 | 120 | 554 | 408 | 79 | 22 | 45 | ||
| CU Boulder | 1,546 | 1,083 | 606 | 362 | 115 | 463 | 254 | 17 | 154 | 38 | ||
| Georgia | 885 | 587 | 287 | 233 | 67 | 298 | 203 | 69 | 1 | 25 | ||
| Kansas | 1,419 | 1,003 | 613 | 213 | 177 | 416 | 304 | 22 | 28 | 62 | ||
| UMass | 1,137 | 784 | 504 | 230 | 50 | 353 | 238 | 62 | 36 | 17 | ||
| Nebraska | 1,421 | 875 | 646 | 104 | 125 | 546 | 445 | 55 | 20 | 26 | ||
| Pittsburgh | 1,234 | 907 | 559 | 210 | 138 | 327 | 211 | 51 | 37 | 28 | ||
| S.Carolina | 2,144 | 1,726 | 876 | 452 | 398 | 418 | 313 | 34 | 20 | 51 | ||
Note: Totals for schools include multiple visits to unique schools.
Cross-university results
National Overview of Recruiting

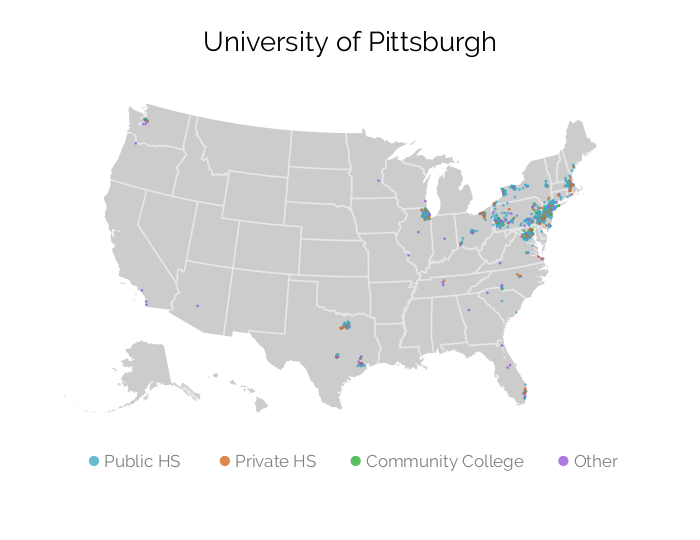
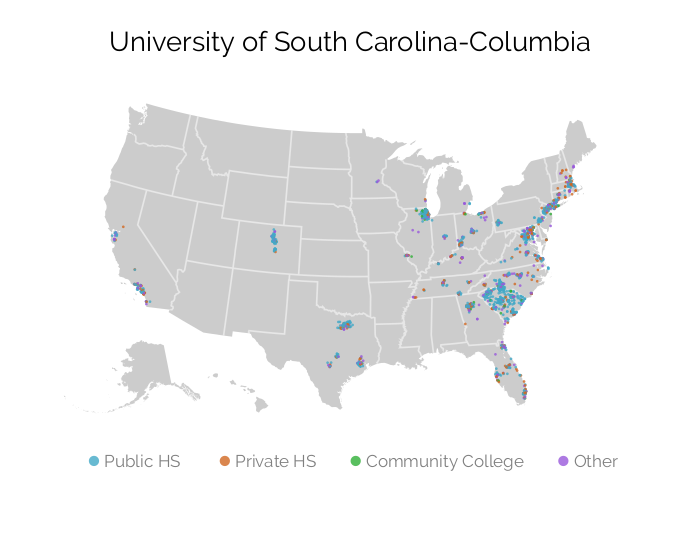
Cross-university results, out-of-state
Descriptive statistics for public high school visits
| NC State | Rutgers | Stony Brook | Alabama | Arkansas | UC Berkeley | UC Irvine | UC Riverside | UC San Diego | Cincinnati | CU Boulder | Georgia | Kansas | UMass | Nebraska | Pittsburgh | S.Carolina | ||||||||||||||||||
|---|---|---|---|---|---|---|---|---|---|---|---|---|---|---|---|---|---|---|---|---|---|---|---|---|---|---|---|---|---|---|---|---|---|---|
| Visit | Nonvisit | Visit | Nonvisit | Visit | Nonvisit | Visit | Nonvisit | Visit | Nonvisit | Visit | Nonvisit | Visit | Nonvisit | Visit | Nonvisit | Visit | Nonvisit | Visit | Nonvisit | Visit | Nonvisit | Visit | Nonvisit | Visit | Nonvisit | Visit | Nonvisit | Visit | Nonvisit | Visit | Nonvisit | Visit | Nonvisit | |
| Number of High Schools | 70 | 5,185 | 442 | 6,638 | 407 | 3,613 | 1,711 | 13,255 | 329 | 6,301 | 207 | 10,916 | 74 | 7,521 | 21 | 6,478 | 145 | 8,659 | 401 | 8,717 | 574 | 12,821 | 249 | 9,333 | 438 | 8,090 | 496 | 8,797 | 420 | 6,003 | 433 | 7,316 | 727 | 11,769 |
| Miles from University | 339 | 437 | 714 | 1,002 | 196 | 506 | 830 | 835 | 406 | 630 | 1,994 | 1,914 | 1,154 | 1,802 | 1,444 | 1,715 | 1,542 | 1,726 | 405 | 719 | 1,137 | 1,114 | 918 | 807 | 518 | 684 | 674 | 1,100 | 373 | 548 | 411 | 613 | 636 | 817 |
| Grade 12 Enrollment | 403 | 201 | 429 | 214 | 332 | 215 | 384 | 169 | 427 | 186 | 442 | 182 | 471 | 191 | 449 | 202 | 419 | 196 | 430 | 199 | 431 | 186 | 490 | 201 | 458 | 172 | 380 | 208 | 391 | 144 | 406 | 188 | 421 | 187 |
| Median Household Income ($000) | $121 | $67 | $113 | $66 | $110 | $66 | $90 | $60 | $87 | $59 | $108 | $62 | $93 | $66 | $78 | $65 | $109 | $66 | $101 | $64 | $115 | $63 | $102 | $63 | $96 | $62 | $115 | $64 | $85 | $61 | $113 | $64 | $106 | $63 |
| Percent Free or Reduced Lunch | 21.5 | 49.2 | 22.9 | 52.0 | 22.8 | 48.8 | 30.7 | 52.2 | 31.4 | 55.9 | 22.5 | 49.9 | 29.7 | 47.9 | 40.0 | 50.2 | 24.9 | 48.3 | 28.3 | 50.9 | 20.6 | 50.1 | 22.6 | 51.2 | 26.1 | 50.3 | 21.4 | 51.7 | 31.1 | 46.6 | 21.0 | 50.0 | 21.6 | 50.5 |
| Percent Enrollment by Race | ||||||||||||||||||||||||||||||||||
| Black, Latinx, Native American | 29.5 | 39.9 | 27.3 | 50.7 | 25.9 | 41.6 | 32.6 | 43.7 | 32.4 | 51.8 | 29.7 | 41.3 | 32.9 | 37.8 | 44.8 | 44.5 | 25.9 | 42.6 | 29.4 | 45.4 | 27.8 | 43.2 | 30.6 | 45.4 | 25.6 | 47.5 | 26.9 | 48.1 | 28.7 | 39.1 | 25.9 | 44.2 | 27.2 | 43.2 |
| White | 57.1 | 52.7 | 54.0 | 41.2 | 61.5 | 52.1 | 56.9 | 49.1 | 56.9 | 40.0 | 52.4 | 51.9 | 43.1 | 54.3 | 36.6 | 47.8 | 52.0 | 49.9 | 54.8 | 46.5 | 56.1 | 48.8 | 54.6 | 46.9 | 62.5 | 44.1 | 57.3 | 43.6 | 61.1 | 55.2 | 59.0 | 49.4 | 60.5 | 49.2 |
| Black | 15.9 | 21.8 | 9.8 | 15.1 | 12.9 | 22.6 | 13.9 | 16.8 | 10.8 | 16.5 | 13.7 | 18.7 | 8.4 | 16.7 | 13.0 | 16.1 | 9.2 | 16.7 | 14.5 | 16.3 | 7.1 | 15.9 | 10.4 | 16.8 | 9.2 | 12.8 | 9.2 | 17.5 | 10.7 | 14.5 | 10.9 | 19.1 | 12.3 | 16.4 |
| Latinx | 13.5 | 17.8 | 17.2 | 35.1 | 12.8 | 18.7 | 18.3 | 26.2 | 20.3 | 34.4 | 15.6 | 21.8 | 24.0 | 20.3 | 30.3 | 27.7 | 16.3 | 25.2 | 14.6 | 28.7 | 20.4 | 26.5 | 19.8 | 27.9 | 15.8 | 33.6 | 17.5 | 30.0 | 17.4 | 24.0 | 14.7 | 24.6 | 14.6 | 26.2 |
| Native American | 0.2 | 0.3 | 0.3 | 0.5 | 0.2 | 0.3 | 0.4 | 0.8 | 1.4 | 0.9 | 0.4 | 0.8 | 0.5 | 0.9 | 1.5 | 0.7 | 0.4 | 0.7 | 0.3 | 0.5 | 0.3 | 0.8 | 0.3 | 0.8 | 0.6 | 1.1 | 0.3 | 0.6 | 0.6 | 0.7 | 0.2 | 0.5 | 0.3 | 0.5 |
| Asian | 10.2 | 4.9 | 15.6 | 5.6 | 10.1 | 3.7 | 7.3 | 4.5 | 7.3 | 5.7 | 14.3 | 4.0 | 15.7 | 4.9 | 12.2 | 4.9 | 16.5 | 4.8 | 12.5 | 5.6 | 12.6 | 5.1 | 11.6 | 5.0 | 8.4 | 5.7 | 13.1 | 5.7 | 7.1 | 3.1 | 12.2 | 3.8 | 9.0 | 5.0 |
| Other Race | 3.1 | 2.5 | 3.1 | 2.5 | 2.5 | 2.6 | 3.3 | 2.6 | 3.4 | 2.6 | 3.5 | 2.8 | 8.3 | 3.0 | 6.4 | 2.9 | 5.6 | 2.8 | 3.3 | 2.4 | 3.5 | 2.9 | 3.2 | 2.7 | 3.5 | 2.7 | 2.6 | 2.7 | 3.0 | 2.6 | 2.9 | 2.6 | 3.3 | 2.6 |
| School Type | ||||||||||||||||||||||||||||||||||
| 0/1 is a Charter School | 0.01 | 0.07 | 0.02 | 0.11 | 0.02 | 0.07 | 0.04 | 0.11 | 0.04 | 0.10 | 0.05 | 0.08 | 0.03 | 0.10 | 0.24 | 0.09 | 0.04 | 0.09 | 0.03 | 0.10 | 0.03 | 0.11 | 0.05 | 0.10 | 0.01 | 0.12 | 0.02 | 0.10 | 0.02 | 0.07 | 0.01 | 0.06 | 0.03 | 0.10 |
| 0/1 is a Magnet School | 0.07 | 0.06 | 0.08 | 0.08 | 0.07 | 0.09 | 0.09 | 0.05 | 0.05 | 0.05 | 0.17 | 0.06 | 0.14 | 0.06 | 0.14 | 0.05 | 0.08 | 0.05 | 0.11 | 0.06 | 0.09 | 0.05 | 0.12 | 0.06 | 0.03 | 0.03 | 0.09 | 0.07 | 0.03 | 0.04 | 0.08 | 0.06 | 0.09 | 0.06 |
| 0/1 is a Regular School | 0.91 | 0.87 | 0.90 | 0.81 | 0.90 | 0.84 | 0.87 | 0.84 | 0.91 | 0.85 | 0.78 | 0.86 | 0.84 | 0.85 | 0.62 | 0.85 | 0.88 | 0.86 | 0.86 | 0.84 | 0.88 | 0.84 | 0.83 | 0.83 | 0.95 | 0.85 | 0.89 | 0.84 | 0.95 | 0.89 | 0.91 | 0.87 | 0.89 | 0.84 |
| Locale | ||||||||||||||||||||||||||||||||||
| In a City | 0.17 | 0.26 | 0.29 | 0.31 | 0.14 | 0.22 | 0.25 | 0.25 | 0.30 | 0.24 | 0.39 | 0.24 | 0.51 | 0.25 | 0.57 | 0.28 | 0.48 | 0.25 | 0.25 | 0.27 | 0.32 | 0.25 | 0.41 | 0.24 | 0.33 | 0.22 | 0.22 | 0.28 | 0.31 | 0.18 | 0.19 | 0.26 | 0.21 | 0.26 |
| In a Suburb | 0.64 | 0.35 | 0.64 | 0.31 | 0.73 | 0.39 | 0.58 | 0.23 | 0.49 | 0.20 | 0.55 | 0.26 | 0.39 | 0.32 | 0.33 | 0.29 | 0.46 | 0.30 | 0.63 | 0.28 | 0.62 | 0.27 | 0.52 | 0.29 | 0.56 | 0.22 | 0.68 | 0.28 | 0.46 | 0.17 | 0.70 | 0.28 | 0.67 | 0.27 |
| In a Town | 0.03 | 0.11 | 0.01 | 0.11 | 0.01 | 0.12 | 0.04 | 0.15 | 0.07 | 0.15 | 0.01 | 0.14 | 0.03 | 0.13 | 0.05 | 0.13 | 0.01 | 0.13 | 0.03 | 0.13 | 0.01 | 0.14 | 0.00 | 0.13 | 0.03 | 0.16 | 0.02 | 0.12 | 0.10 | 0.17 | 0.02 | 0.12 | 0.01 | 0.13 |
| In a Rural Area | 0.16 | 0.27 | 0.07 | 0.28 | 0.11 | 0.27 | 0.13 | 0.37 | 0.14 | 0.41 | 0.05 | 0.36 | 0.07 | 0.30 | 0.05 | 0.29 | 0.04 | 0.32 | 0.09 | 0.32 | 0.05 | 0.34 | 0.07 | 0.34 | 0.08 | 0.40 | 0.08 | 0.31 | 0.14 | 0.48 | 0.08 | 0.33 | 0.11 | 0.34 |
Note: Schools that satisfied the following criteria were included in the sample: offers grades 9-12 and enrolls at least ten students in each grade; located in the 50 U.S. states, the District of Columbia, or land regulated by the Bureau of Indian Affairs; is not a special education school, alternative school, virtual school, or independent school; is an open status school and reports enrollment to the Federal Department of Education. Non-visited schools include only out-of-state schools in states that received at least one high school visit.
Cross-university results, out-of-state
Probability of out-of-state public high school receiving a visit
| NC State | Rutgers | Stony Brook | Alabama | Arkansas | UC Berkeley | UC Irvine | UC Riverside | UC San Diego | Cincinnati | CU Boulder | Georgia | Kansas | UMass | Nebraska | Pittsburgh | S.Carolina | |
|---|---|---|---|---|---|---|---|---|---|---|---|---|---|---|---|---|---|
| Income (ref=<$50k) | |||||||||||||||||
| $50k-$74k | -0.001 (0.002) | -0.011** (0.004) | -0.020** (0.007) | 0.004 (0.004) | 0.002 (0.004) | -0.003 (0.002) | -0.001 (0.002) | 0.002 (0.001) | -0.003 (0.002) | 0.001 (0.003) | -0.008*** (0.002) | -0.004 (0.003) | -0.003 (0.004) | -0.012*** (0.003) | 0.001 (0.005) | -0.010** (0.003) | 0.003 (0.003) |
| $75k-$99k | 0.005 (0.005) | 0.019* (0.008) | 0.016 (0.013) | 0.081*** (0.009) | 0.044*** (0.010) | 0.008 (0.004) | 0.006 (0.004) | 0.0002 (0.002) | 0.009* (0.004) | 0.030*** (0.007) | 0.024*** (0.005) | 0.008 (0.006) | 0.051*** (0.008) | 0.022** (0.007) | 0.049*** (0.010) | 0.032*** (0.008) | 0.038*** (0.006) |
| $100k-$149k | 0.047*** (0.009) | 0.171*** (0.014) | 0.185*** (0.021) | 0.207*** (0.014) | 0.184*** (0.023) | 0.072*** (0.010) | 0.042*** (0.008) | 0.010* (0.005) | 0.049*** (0.008) | 0.115*** (0.012) | 0.169*** (0.011) | 0.068*** (0.011) | 0.182*** (0.017) | 0.178*** (0.013) | 0.191*** (0.025) | 0.153*** (0.014) | 0.200*** (0.012) |
| $150k-$199k | 0.166*** (0.047) | 0.393*** (0.050) | 0.433*** (0.057) | 0.414*** (0.041) | 0.066 (0.047) | 0.262*** (0.049) | 0.033 (0.020) | 0.0001 (0.002) | 0.136*** (0.035) | 0.276*** (0.045) | 0.500*** (0.044) | 0.168*** (0.041) | 0.230*** (0.051) | 0.444*** (0.049) | 0.224* (0.089) | 0.480*** (0.050) | 0.422*** (0.043) |
| $200k+ | 0.104 (0.077) | 0.398*** (0.090) | 0.482*** (0.120) | 0.481*** (0.075) | 0.398** (0.141) | 0.366*** (0.099) | 0.005 (0.005) | 0.001 (0.003) | 0.354*** (0.096) | 0.248*** (0.075) | 0.765*** (0.066) | 0.361*** (0.108) | 0.385** (0.118) | 0.654*** (0.078) | 0.084 (0.129) | 0.550*** (0.095) | 0.437*** (0.086) |
| BL, LX, NA Enrollment (ref=<20%) | |||||||||||||||||
| 20-39% | 0.001 (0.006) | 0.002 (0.010) | -0.010 (0.015) | 0.029*** (0.008) | 0.025** (0.008) | -0.009* (0.004) | -0.004 (0.004) | -0.0003 (0.002) | -0.001 (0.004) | 0.012 (0.007) | 0.007 (0.005) | 0.002 (0.005) | 0.027*** (0.007) | -0.017* (0.008) | 0.022* (0.009) | -0.001 (0.008) | 0.026*** (0.007) |
| 40-59% | -0.012** (0.005) | -0.039*** (0.010) | -0.028 (0.016) | -0.011 (0.008) | 0.0001 (0.008) | -0.015*** (0.004) | 0.002 (0.005) | 0.003 (0.003) | -0.010 (0.005) | 0.012 (0.008) | -0.016** (0.006) | -0.012* (0.005) | -0.016* (0.007) | -0.031*** (0.008) | 0.001 (0.011) | -0.020* (0.009) | -0.011 (0.007) |
| 60-79% | 0.007 (0.008) | -0.048*** (0.011) | -0.054** (0.017) | -0.046*** (0.009) | -0.007 (0.009) | -0.017*** (0.005) | -0.004 (0.005) | -0.001 (0.003) | -0.022*** (0.005) | -0.001 (0.009) | -0.037*** (0.006) | -0.027*** (0.005) | -0.032*** (0.008) | -0.041*** (0.008) | 0.010 (0.012) | -0.040*** (0.008) | -0.028*** (0.007) |
| 80-89% | 0.005 (0.009) | -0.070*** (0.011) | -0.077*** (0.020) | -0.042*** (0.011) | -0.022* (0.009) | -0.022*** (0.006) | -0.011* (0.005) | -0.005* (0.002) | -0.023*** (0.006) | -0.006 (0.009) | -0.052*** (0.006) | -0.035*** (0.006) | -0.034*** (0.009) | -0.057*** (0.008) | -0.023 (0.014) | -0.042*** (0.010) | -0.038*** (0.008) |
| 90%+ | -0.001 (0.005) | -0.075*** (0.010) | -0.087*** (0.015) | -0.073*** (0.008) | -0.026** (0.008) | -0.029*** (0.004) | -0.012** (0.004) | -0.002 (0.003) | -0.027*** (0.005) | -0.012 (0.007) | -0.051*** (0.005) | -0.036*** (0.005) | -0.033*** (0.007) | -0.063*** (0.007) | -0.007 (0.011) | -0.050*** (0.008) | -0.039*** (0.006) |
| # Math Proficient Students (ref=<50) | |||||||||||||||||
| 50-99 | -0.004* (0.002) | -0.012* (0.005) | 0.003 (0.013) | -0.004 (0.005) | -0.003 (0.006) | -0.003 (0.002) | -0.0005 (0.003) | 0.006* (0.003) | -0.007* (0.003) | -0.006 (0.004) | -0.006 (0.003) | -0.003 (0.002) | -0.006 (0.005) | 0.007 (0.005) | 0.061*** (0.009) | -0.004 (0.005) | -0.005 (0.003) |
| 100-199 | 0.0003 (0.004) | -0.005 (0.009) | -0.014 (0.014) | 0.027*** (0.008) | 0.018 (0.010) | 0.003 (0.004) | -0.008 (0.004) | 0.001 (0.003) | -0.011* (0.005) | -0.011 (0.007) | 0.0003 (0.005) | 0.003 (0.004) | -0.014 (0.008) | 0.001 (0.007) | 0.070*** (0.013) | -0.006 (0.007) | -0.008 (0.006) |
| 200-299 | 0.012 (0.007) | 0.020 (0.014) | 0.003 (0.020) | 0.056*** (0.014) | 0.029 (0.018) | 0.006 (0.007) | -0.014* (0.007) | -0.005 (0.003) | -0.006 (0.008) | -0.037*** (0.011) | -0.005 (0.010) | 0.022* (0.008) | -0.015 (0.015) | 0.011 (0.011) | 0.078*** (0.021) | 0.011 (0.013) | -0.008 (0.011) |
| 300-399 | 0.014 (0.011) | -0.021 (0.017) | 0.022 (0.025) | 0.053** (0.019) | 0.088*** (0.027) | 0.015 (0.011) | -0.017 (0.010) | -0.003 (0.005) | -0.007 (0.010) | -0.025 (0.016) | -0.001 (0.014) | 0.045*** (0.013) | -0.028 (0.021) | 0.032* (0.015) | -0.013 (0.025) | 0.007 (0.017) | 0.028 (0.016) |
| 400+ | 0.030** (0.011) | -0.002 (0.016) | -0.043* (0.019) | 0.137*** (0.020) | 0.003 (0.026) | 0.012 (0.011) | -0.028** (0.009) | -0.001 (0.006) | -0.015 (0.010) | -0.011 (0.017) | -0.033** (0.012) | 0.004 (0.012) | -0.149*** (0.015) | 0.022 (0.013) | -0.098*** (0.023) | -0.060*** (0.016) | 0.069*** (0.017) |
| # G12 Students (ref=<50) | |||||||||||||||||
| 50-99 | -0.003 (0.002) | -0.001 (0.003) | 0.014 (0.009) | 0.006 (0.004) | 0.014*** (0.004) | 0.0003 (0.002) | 0.006** (0.002) | 0.001 (0.002) | 0.003 (0.002) | 0.001 (0.003) | 0.004 (0.002) | -0.001 (0.002) | 0.014*** (0.003) | -0.005 (0.004) | 0.006 (0.005) | -0.004 (0.004) | -0.00003 (0.002) |
| 100-199 | -0.001 (0.004) | -0.0004 (0.006) | 0.016 (0.011) | 0.015** (0.005) | 0.032*** (0.006) | -0.004 (0.003) | 0.009** (0.003) | 0.0005 (0.002) | 0.007 (0.004) | 0.006 (0.005) | -0.001 (0.003) | -0.002 (0.003) | 0.036*** (0.006) | 0.002 (0.005) | 0.026** (0.008) | -0.003 (0.006) | 0.004 (0.004) |
| 200-299 | -0.012* (0.005) | 0.028** (0.010) | 0.065*** (0.016) | 0.075*** (0.009) | 0.043*** (0.010) | -0.003 (0.004) | 0.018*** (0.005) | 0.005 (0.003) | 0.018** (0.006) | 0.024*** (0.007) | 0.012* (0.005) | -0.007 (0.004) | 0.076*** (0.010) | 0.017* (0.008) | 0.065*** (0.014) | 0.014 (0.009) | 0.028*** (0.007) |
| 300-399 | 0.010 (0.008) | 0.079*** (0.014) | 0.085*** (0.019) | 0.162*** (0.013) | 0.078*** (0.014) | 0.013 (0.007) | 0.031*** (0.007) | 0.008 (0.004) | 0.011 (0.007) | 0.063*** (0.010) | 0.042*** (0.008) | 0.014 (0.008) | 0.148*** (0.014) | 0.019 (0.010) | 0.143*** (0.020) | 0.056*** (0.013) | 0.067*** (0.010) |
| 400-499 | 0.008 (0.011) | 0.084*** (0.016) | 0.138*** (0.025) | 0.198*** (0.016) | 0.105*** (0.018) | 0.034*** (0.010) | 0.031*** (0.009) | 0.006 (0.005) | 0.033*** (0.010) | 0.135*** (0.015) | 0.070*** (0.011) | 0.046*** (0.011) | 0.200*** (0.017) | 0.012 (0.012) | 0.190*** (0.024) | 0.096*** (0.018) | 0.080*** (0.013) |
| 500+ | 0.016 (0.013) | 0.125*** (0.017) | 0.125*** (0.026) | 0.201*** (0.017) | 0.124*** (0.018) | 0.056*** (0.012) | 0.075*** (0.013) | 0.016* (0.006) | 0.057*** (0.012) | 0.149*** (0.016) | 0.128*** (0.013) | 0.094*** (0.012) | 0.250*** (0.016) | 0.048*** (0.013) | 0.283*** (0.028) | 0.175*** (0.022) | 0.139*** (0.015) |
| Locale (ref=suburb) | |||||||||||||||||
| City | 0.003 (0.005) | 0.020* (0.009) | -0.0002 (0.013) | -0.011 (0.008) | -0.004 (0.010) | 0.024*** (0.005) | 0.020*** (0.005) | 0.004 (0.003) | 0.032*** (0.006) | -0.006 (0.007) | 0.026*** (0.006) | 0.035*** (0.006) | 0.019* (0.009) | -0.007 (0.007) | 0.029* (0.014) | 0.0003 (0.008) | -0.004 (0.007) |
| Rural | 0.007 (0.005) | -0.032*** (0.008) | -0.047*** (0.013) | -0.049*** (0.008) | -0.039*** (0.010) | -0.002 (0.004) | 0.006* (0.003) | 0.001 (0.002) | -0.005 (0.004) | -0.018** (0.006) | -0.023*** (0.005) | -0.001 (0.004) | -0.040*** (0.008) | -0.045*** (0.007) | -0.024* (0.010) | -0.031*** (0.007) | -0.025*** (0.006) |
| Town | 0.008 (0.005) | -0.022** (0.007) | -0.048*** (0.012) | -0.051*** (0.008) | -0.031** (0.010) | 0.003 (0.004) | 0.004 (0.003) | 0.001 (0.002) | -0.002 (0.004) | -0.013* (0.006) | -0.015*** (0.004) | 0.001 (0.004) | -0.040*** (0.008) | -0.037*** (0.006) | -0.030** (0.011) | -0.020** (0.007) | -0.027*** (0.005) |
| School Type (ref=regular school) | |||||||||||||||||
| Charter | -0.001 (0.004) | 0.006 (0.007) | 0.006 (0.015) | 0.017* (0.007) | 0.044*** (0.009) | 0.005 (0.004) | -0.005 (0.003) | 0.008* (0.004) | -0.008* (0.004) | 0.032*** (0.006) | -0.010* (0.004) | 0.004 (0.005) | 0.028*** (0.006) | -0.005 (0.005) | -0.005 (0.009) | -0.001 (0.007) | 0.016** (0.006) |
| Magnet | -0.006 (0.008) | -0.011 (0.011) | 0.036* (0.017) | 0.014 (0.013) | -0.012 (0.012) | 0.031*** (0.009) | 0.014* (0.007) | 0.006 (0.006) | 0.006 (0.008) | 0.031** (0.011) | 0.015 (0.009) | -0.0002 (0.009) | -0.024 (0.014) | 0.025* (0.010) | -0.013 (0.015) | 0.007 (0.011) | 0.005 (0.010) |
| Distance (in 10 miles) | -0.001*** (0.0001) | -0.0002*** (0.00005) | -0.002*** (0.0001) | -0.0004*** (0.0001) | -0.001*** (0.0001) | -0.00005* (0.00002) | -0.0001*** (0.00003) | -0.00002 (0.00002) | -0.0001*** (0.00003) | -0.001*** (0.00005) | -0.0003*** (0.00004) | -0.00005 (0.00004) | -0.002*** (0.0001) | -0.0002*** (0.00003) | -0.003*** (0.0002) | -0.0004*** (0.00005) | -0.0005*** (0.00004) |
| Constant | 0.020* (0.008) | 0.059*** (0.009) | 0.136*** (0.016) | 0.073*** (0.010) | 0.080*** (0.012) | 0.014* (0.007) | 0.011 (0.007) | -0.002 (0.004) | 0.029*** (0.008) | 0.052*** (0.008) | 0.048*** (0.007) | 0.008 (0.006) | 0.108*** (0.010) | 0.080*** (0.009) | 0.146*** (0.014) | 0.060*** (0.009) | 0.053*** (0.007) |
| Observations | 5,255 | 7,080 | 4,020 | 14,966 | 6,630 | 11,123 | 7,595 | 6,499 | 8,804 | 9,118 | 13,395 | 9,582 | 8,528 | 9,293 | 6,423 | 7,749 | 12,496 |
| Akaike Inf. Crit. | -8,194.381 | -1,558.505 | 795.523 | 4,100.220 | -2,687.403 | -14,182.270 | -14,152.650 | -18,875.090 | -12,007.360 | -4,444.908 | -8,233.677 | -9,137.925 | -3,973.539 | -3,465.529 | -1,616.430 | -2,628.136 | -3,878.221 |
Note: *p<0.05; **p<0.01; ***p<0.001. Robust standard errors in parentheses. Schools that satisfied the following criteria were included in the sample: offers grades 9-12 and enrolls at least ten students in each grade; located in the 50 U.S. states, the District of Columbia, or land regulated by the Bureau of Indian Affairs; is not a special education school, alternative school, virtual school, or independent school; is an open status school and reports enrollment to the Federal Department of Education. Non-visited schools include only out-of-state schools in states that received at least one high school visit.
Cross-university results, out-of-state
Descriptive statistics for private high school visits
| NC State | Rutgers | Stony Brook | Alabama | Arkansas | UC Berkeley | UC Irvine | UC Riverside | UC San Diego | Cincinnati | CU Boulder | Georgia | Kansas | UMass | Nebraska | Pittsburgh | S.Carolina | ||||||||||||||||||
|---|---|---|---|---|---|---|---|---|---|---|---|---|---|---|---|---|---|---|---|---|---|---|---|---|---|---|---|---|---|---|---|---|---|---|
| Visit | Nonvisit | Visit | Nonvisit | Visit | Nonvisit | Visit | Nonvisit | Visit | Nonvisit | Visit | Nonvisit | Visit | Nonvisit | Visit | Nonvisit | Visit | Nonvisit | Visit | Nonvisit | Visit | Nonvisit | Visit | Nonvisit | Visit | Nonvisit | Visit | Nonvisit | Visit | Nonvisit | Visit | Nonvisit | Visit | Nonvisit | |
| Number of High Schools | 19 | 1,535 | 188 | 1,723 | 83 | 1,206 | 681 | 2,788 | 144 | 1,256 | 153 | 2,449 | 37 | 1,852 | 32 | 1,590 | 105 | 2,063 | 167 | 2,059 | 327 | 2,780 | 192 | 2,152 | 150 | 1,414 | 218 | 2,254 | 66 | 951 | 172 | 1,828 | 361 | 2,640 |
| Grade 12 Enrollment | 161 | 70 | 156 | 64 | 144 | 66 | 125 | 55 | 123 | 59 | 124 | 63 | 188 | 69 | 134 | 68 | 143 | 66 | 145 | 64 | 145 | 62 | 134 | 62 | 164 | 60 | 149 | 63 | 169 | 60 | 145 | 62 | 138 | 61 |
| Percent Enrollment by Race | ||||||||||||||||||||||||||||||||||
| Black, Latinx, Native American | 26.8 | 19.5 | 17.6 | 21.6 | 20.9 | 20.8 | 17.2 | 18.7 | 16.8 | 19.3 | 16.9 | 18.2 | 15.4 | 18.1 | 12.1 | 20.0 | 15.3 | 19.4 | 14.9 | 18.7 | 18.1 | 19.0 | 13.7 | 20.8 | 16.3 | 19.8 | 17.8 | 20.2 | 16.0 | 18.7 | 15.2 | 19.2 | 15.6 | 19.8 |
| White | 63.2 | 71.0 | 68.4 | 65.4 | 67.0 | 69.0 | 71.0 | 70.5 | 73.2 | 67.5 | 65.2 | 71.9 | 44.5 | 71.2 | 69.4 | 68.0 | 60.1 | 69.8 | 72.8 | 69.1 | 64.9 | 69.0 | 74.4 | 67.4 | 71.4 | 66.3 | 68.7 | 67.8 | 75.0 | 71.8 | 72.2 | 71.1 | 73.2 | 68.5 |
| Black | 17.6 | 10.1 | 8.2 | 8.4 | 8.0 | 11.1 | 6.6 | 9.3 | 7.0 | 8.2 | 7.8 | 8.9 | 5.8 | 8.4 | 5.7 | 8.2 | 7.1 | 8.9 | 7.9 | 8.7 | 6.5 | 8.9 | 5.7 | 9.6 | 5.4 | 8.0 | 6.8 | 9.1 | 4.5 | 9.0 | 7.6 | 8.9 | 7.0 | 9.2 |
| Latinx | 9.0 | 9.1 | 9.0 | 12.9 | 12.5 | 9.5 | 10.2 | 9.0 | 9.3 | 10.8 | 8.6 | 8.9 | 8.9 | 9.3 | 6.2 | 11.4 | 7.8 | 10.2 | 6.7 | 9.7 | 11.1 | 9.7 | 7.5 | 10.9 | 10.3 | 11.3 | 10.7 | 10.7 | 10.1 | 9.4 | 7.3 | 10.0 | 8.3 | 10.3 |
| Native American | 0.2 | 0.2 | 0.4 | 0.3 | 0.4 | 0.3 | 0.4 | 0.4 | 0.5 | 0.4 | 0.4 | 0.4 | 0.7 | 0.4 | 0.3 | 0.4 | 0.5 | 0.3 | 0.2 | 0.3 | 0.5 | 0.4 | 0.5 | 0.3 | 0.6 | 0.4 | 0.3 | 0.3 | 1.3 | 0.3 | 0.3 | 0.3 | 0.3 | 0.3 |
| Asian | 6.6 | 5.7 | 8.5 | 8.0 | 8.1 | 6.3 | 7.0 | 6.6 | 6.6 | 7.9 | 7.7 | 5.8 | 14.2 | 6.4 | 11.2 | 6.8 | 11.1 | 6.4 | 8.5 | 7.3 | 9.0 | 7.2 | 6.7 | 7.2 | 6.9 | 8.6 | 7.8 | 7.4 | 5.3 | 5.8 | 7.9 | 5.9 | 6.9 | 7.0 |
| Other Race | 3.4 | 3.9 | 5.5 | 5.0 | 4.0 | 3.9 | 4.7 | 4.2 | 3.5 | 5.2 | 10.3 | 4.1 | 25.9 | 4.3 | 7.2 | 5.2 | 13.5 | 4.3 | 3.8 | 4.9 | 8.1 | 4.9 | 5.2 | 4.6 | 5.3 | 5.4 | 5.6 | 4.6 | 3.7 | 3.8 | 4.7 | 3.8 | 4.3 | 4.6 |
| Locale | ||||||||||||||||||||||||||||||||||
| In a City | 0.32 | 0.37 | 0.43 | 0.45 | 0.25 | 0.29 | 0.49 | 0.38 | 0.65 | 0.44 | 0.56 | 0.38 | 0.54 | 0.38 | 0.56 | 0.43 | 0.54 | 0.39 | 0.49 | 0.43 | 0.52 | 0.41 | 0.60 | 0.38 | 0.57 | 0.41 | 0.47 | 0.41 | 0.62 | 0.42 | 0.41 | 0.41 | 0.47 | 0.41 |
| In a Suburb | 0.68 | 0.45 | 0.50 | 0.40 | 0.66 | 0.49 | 0.41 | 0.38 | 0.29 | 0.30 | 0.37 | 0.39 | 0.30 | 0.45 | 0.31 | 0.40 | 0.36 | 0.43 | 0.44 | 0.37 | 0.42 | 0.39 | 0.33 | 0.41 | 0.41 | 0.34 | 0.42 | 0.40 | 0.29 | 0.33 | 0.52 | 0.40 | 0.45 | 0.40 |
| In a Town | 0.00 | 0.04 | 0.01 | 0.03 | 0.00 | 0.04 | 0.02 | 0.07 | 0.00 | 0.08 | 0.01 | 0.06 | 0.03 | 0.04 | 0.00 | 0.04 | 0.01 | 0.05 | 0.02 | 0.05 | 0.01 | 0.06 | 0.00 | 0.06 | 0.02 | 0.09 | 0.01 | 0.05 | 0.02 | 0.10 | 0.01 | 0.04 | 0.01 | 0.05 |
| In a Rural Area | 0.00 | 0.13 | 0.06 | 0.12 | 0.08 | 0.17 | 0.09 | 0.17 | 0.06 | 0.18 | 0.06 | 0.16 | 0.14 | 0.13 | 0.12 | 0.12 | 0.09 | 0.14 | 0.05 | 0.15 | 0.06 | 0.14 | 0.07 | 0.15 | 0.01 | 0.16 | 0.10 | 0.14 | 0.08 | 0.14 | 0.06 | 0.15 | 0.08 | 0.14 |
Note: Schools that satisfied the following criteria were included in the sample: offers grades 9-12 and enrolls at least ten students in each grade; located in the 50 U.S. states, the District of Columbia, or land regulated by the Bureau of Indian Affairs; is not a special education school, an alternative school, an early childhood center, or an independent school. Non-visited schools include only out-of-state schools in states that received at least one high school visit.
Cross-university results
Actual versus Proportional Visits to Out-of-State High Schools
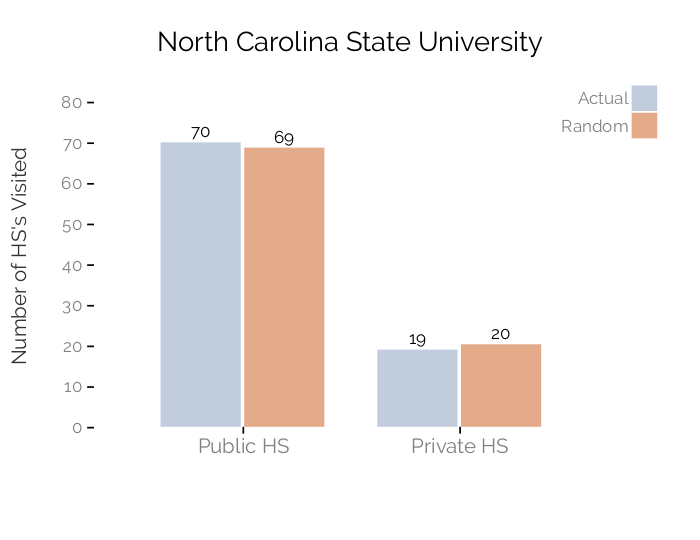
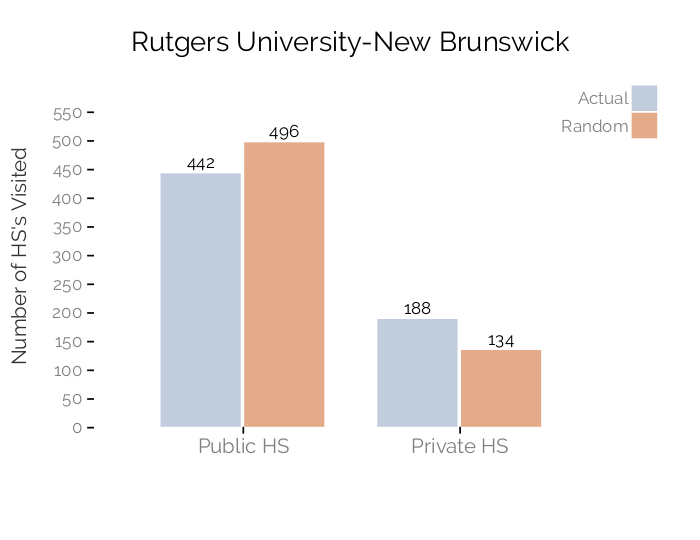
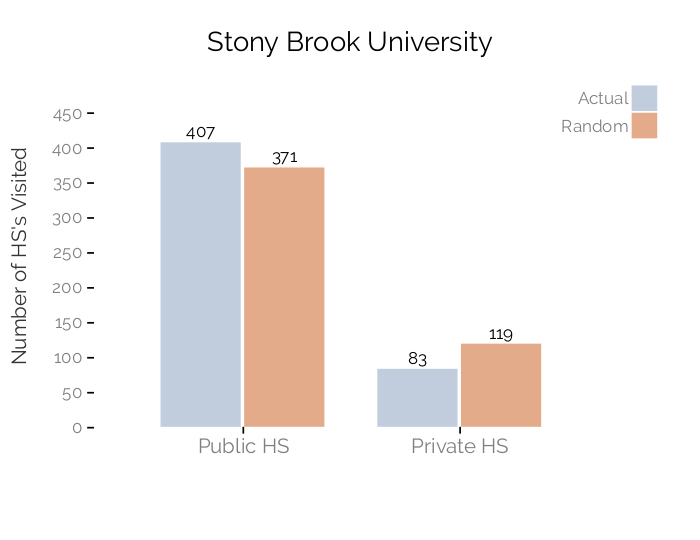
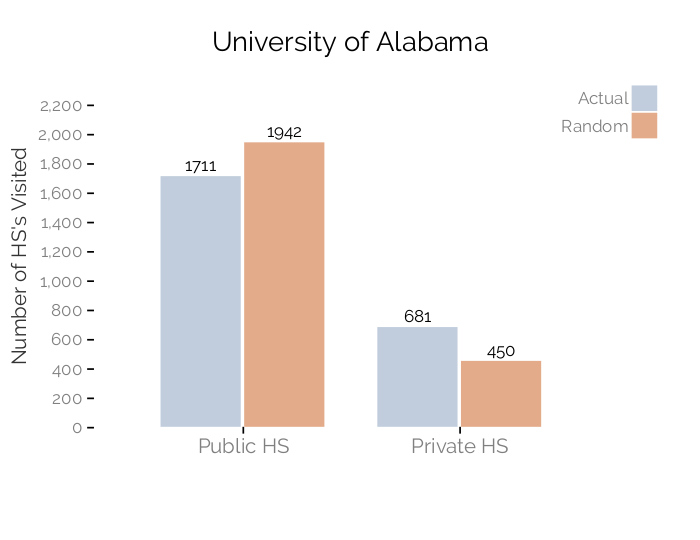
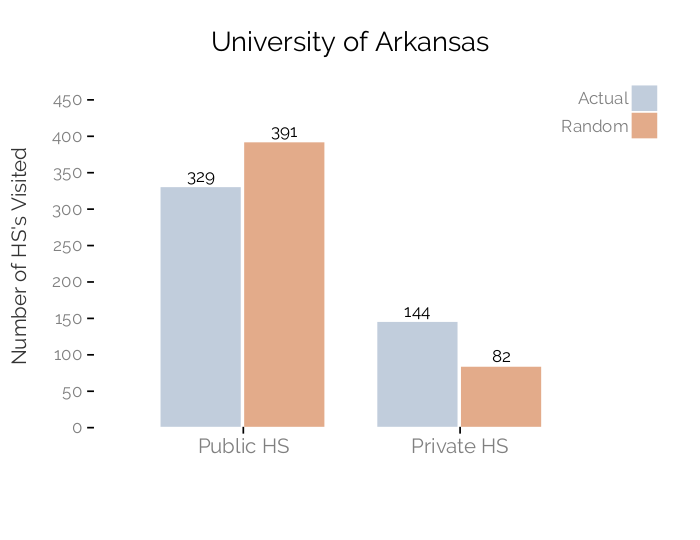
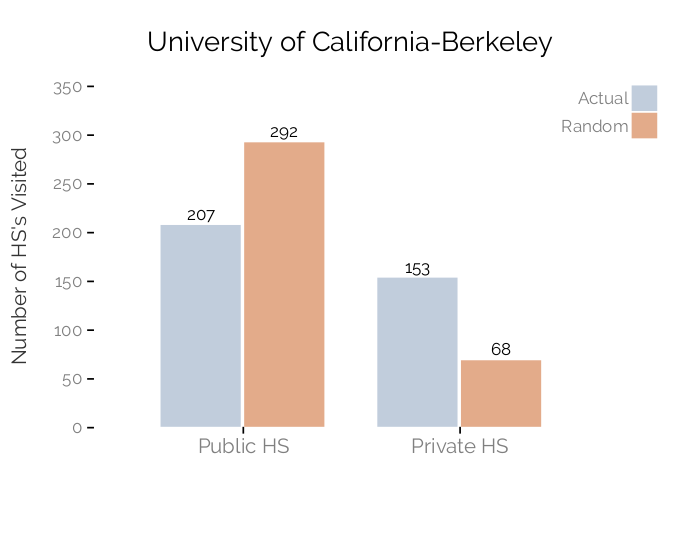
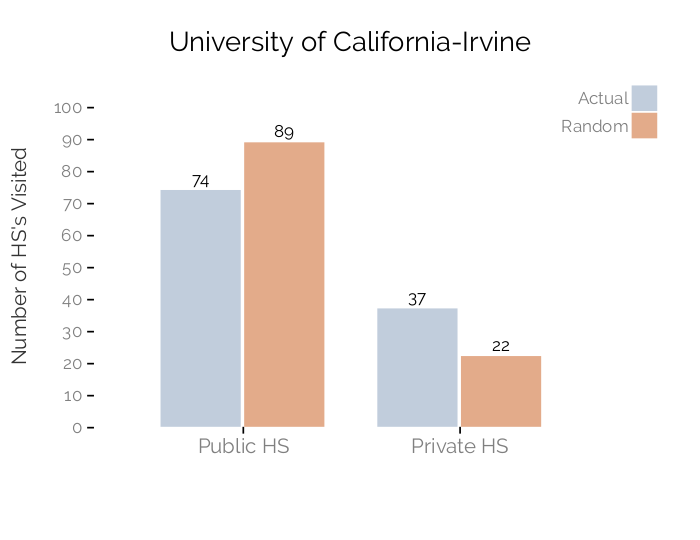
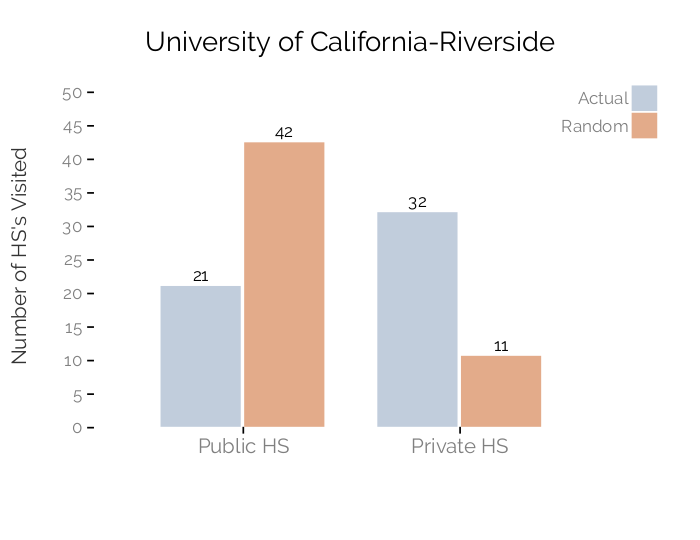
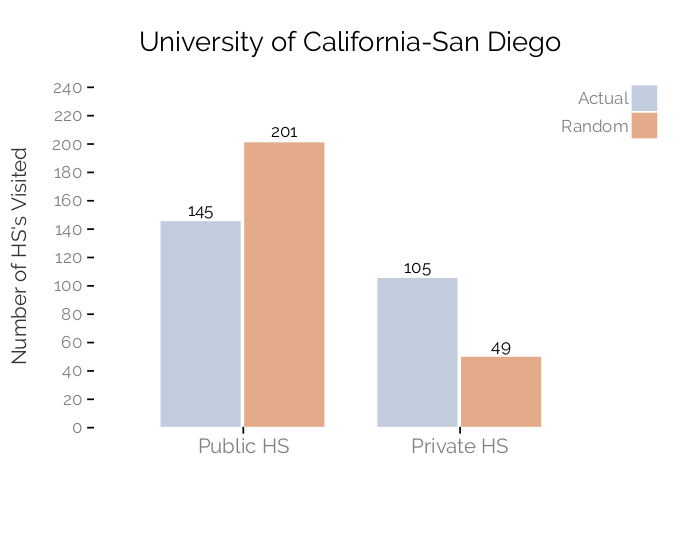
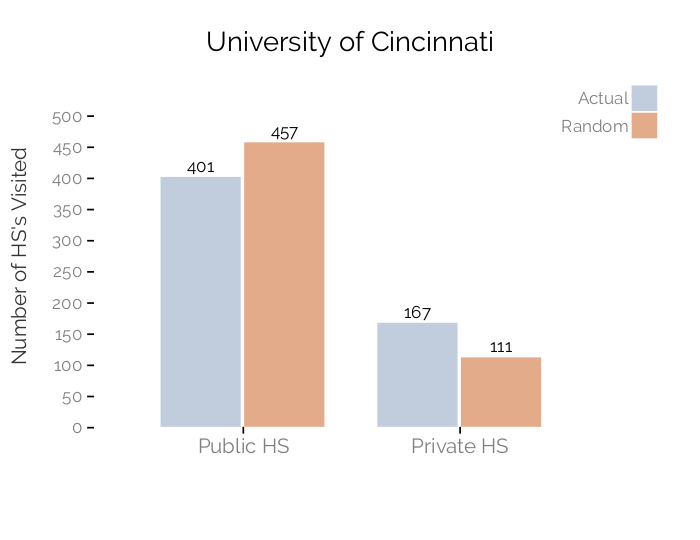

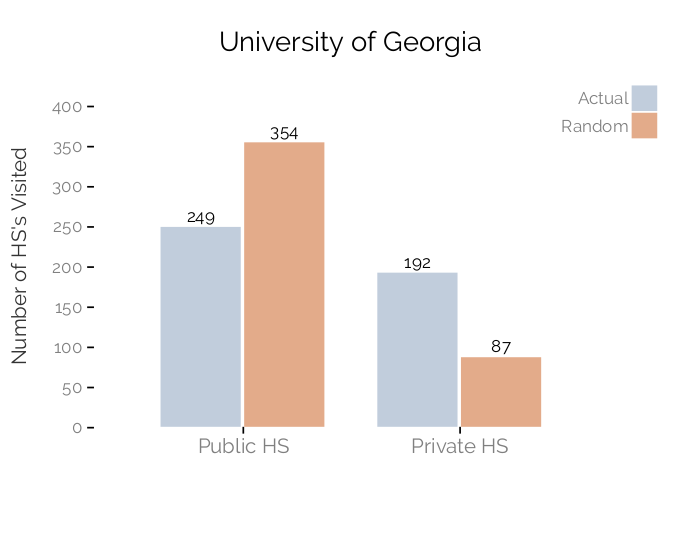
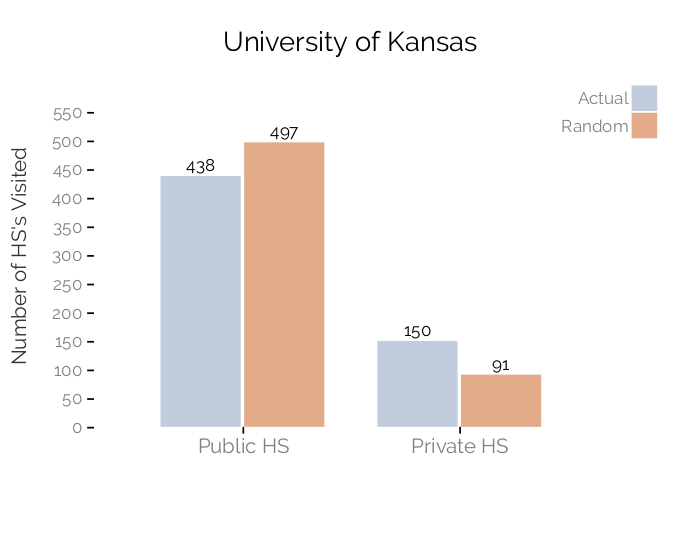

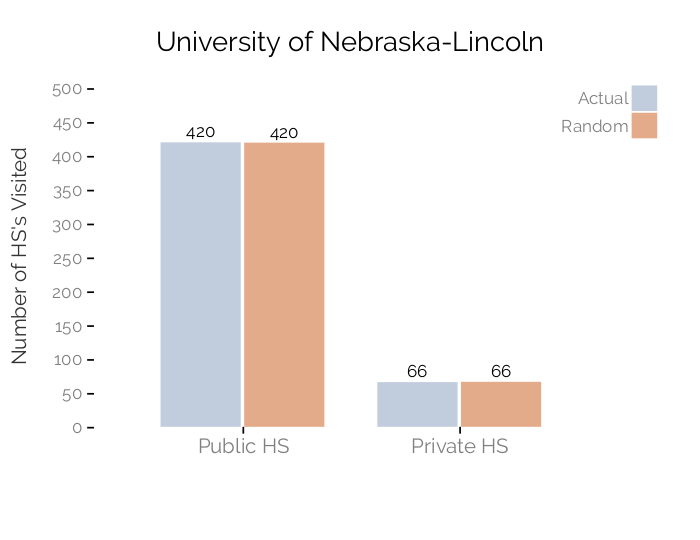
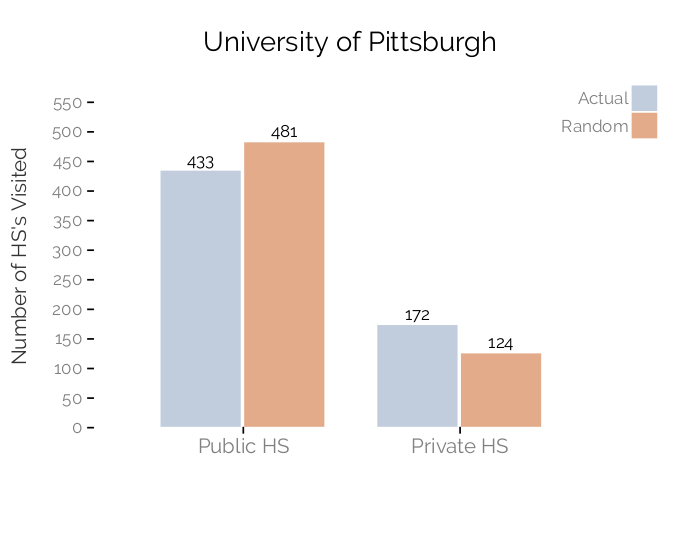
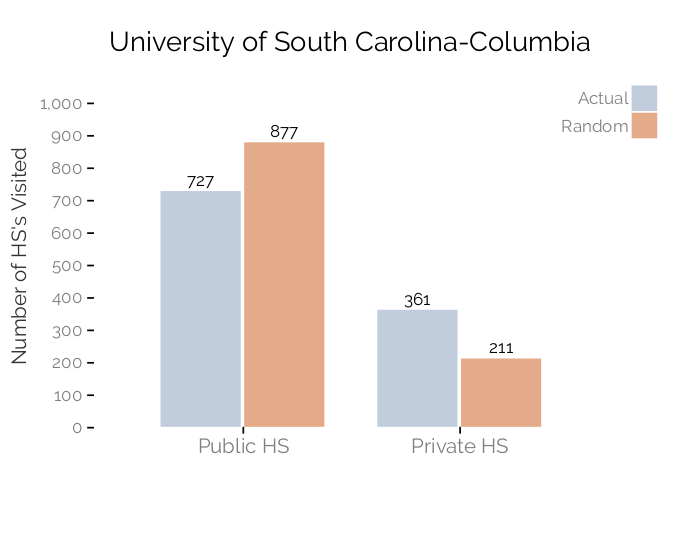
Note: Schools that satisfied the following criteria were included in the sample: offers grades 9-12 and enrolls at least ten students in each grade; located in the 50 U.S. states, the District of Columbia, or land regulated by the Bureau of Indian Affairs; is not a special education school, alternative school, virtual school (public HS), early childhood center (private HS), or independent school; is an open status school and reports enrollment to the Federal Department of Education (public HS). Non-visited schools include only out-of-state schools in states that received at least one high school visit.
Cross-university results, in-state
Descriptive statistics for public high school visits
| NC State | Rutgers | Stony Brook | Alabama | Arkansas | UC Berkeley | UC Irvine | UC Riverside | UC San Diego | Cincinnati | CU Boulder | Georgia | Kansas | UMass | Nebraska | Pittsburgh | S.Carolina | ||||||||||||||||||
|---|---|---|---|---|---|---|---|---|---|---|---|---|---|---|---|---|---|---|---|---|---|---|---|---|---|---|---|---|---|---|---|---|---|---|
| Visit | Nonvisit | Visit | Nonvisit | Visit | Nonvisit | Visit | Nonvisit | Visit | Nonvisit | Visit | Nonvisit | Visit | Nonvisit | Visit | Nonvisit | Visit | Nonvisit | Visit | Nonvisit | Visit | Nonvisit | Visit | Nonvisit | Visit | Nonvisit | Visit | Nonvisit | Visit | Nonvisit | Visit | Nonvisit | Visit | Nonvisit | |
| Number of High Schools | 143 | 361 | 253 | 147 | 229 | 927 | 113 | 228 | 124 | 113 | 297 | 1,107 | 232 | 1,172 | 356 | 1,048 | 515 | 889 | 353 | 464 | 181 | 132 | 173 | 245 | 209 | 108 | 216 | 132 | 217 | 30 | 185 | 467 | 153 | 56 |
| Percent of High Schools | 28.4 | 71.6 | 63.2 | 36.8 | 19.8 | 80.2 | 33.1 | 66.9 | 52.3 | 47.7 | 21.2 | 78.8 | 16.5 | 83.5 | 25.4 | 74.6 | 36.7 | 63.3 | 43.2 | 56.8 | 57.8 | 42.2 | 41.4 | 58.6 | 65.9 | 34.1 | 62.1 | 37.9 | 87.9 | 12.1 | 28.4 | 71.6 | 73.2 | 26.8 |
| Miles from University | 87 | 103 | 31 | 35 | 35 | 144 | 98 | 101 | 131 | 137 | 172 | 253 | 131 | 216 | 84 | 246 | 204 | 279 | 119 | 157 | 61 | 108 | 85 | 98 | 118 | 168 | 61 | 65 | 112 | 149 | 131 | 155 | 68 | 81 |
| Grade 12 Enrollment | 239 | 169 | 259 | 186 | 318 | 118 | 204 | 97 | 132 | 66 | 435 | 266 | 467 | 269 | 481 | 241 | 450 | 216 | 199 | 83 | 257 | 53 | 313 | 207 | 135 | 31 | 214 | 158 | 101 | 27 | 288 | 134 | 240 | 109 |
| Number Proficient-Math | 109 | 77 | 105 | 60 | 303 | 103 | 53 | 14 | 51 | 21 | 137 | 74 | 129 | 80 | 150 | 66 | 151 | 50 | 183 | 82 | 91 | 18 | 141 | 72 | 36 | 6 | 179 | 118 | 58 | 15 | 205 | 76 | 207 | 94 |
| Median Household Income ($000) | $52 | $53 | $95 | $86 | $103 | $64 | $54 | $44 | $47 | $45 | $84 | $67 | $69 | $71 | $75 | $69 | $84 | $62 | $67 | $53 | $75 | $61 | $61 | $50 | $65 | $57 | $95 | $82 | $63 | $62 | $79 | $59 | $52 | $43 |
| Percent Free or Reduced Lunch | 53.3 | 50.9 | 35.1 | 34.0 | 37.3 | 55.6 | 44.3 | 60.2 | 59.2 | 65.6 | 51.7 | 58.5 | 61.6 | 56.2 | 58.2 | 56.7 | 49.5 | 61.5 | 40.1 | 53.6 | 36.8 | 46.1 | 55.5 | 68.0 | 42.9 | 47.6 | 32.9 | 48.2 | 37.3 | 44.2 | 31.5 | 51.8 | 53.3 | 65.8 |
| Percent Enrollment by Race | ||||||||||||||||||||||||||||||||||
| Black, Latinx, Native American | 37.7 | 41.7 | 41.2 | 35.6 | 39.1 | 42.5 | 34.2 | 39.0 | 28.8 | 34.7 | 55.5 | 58.9 | 65.8 | 55.2 | 61.7 | 55.4 | 54.5 | 61.8 | 21.3 | 20.7 | 36.4 | 36.2 | 48.3 | 49.9 | 26.1 | 13.8 | 23.6 | 29.5 | 23.6 | 13.4 | 15.7 | 29.5 | 41.7 | 42.7 |
| White | 56.2 | 52.2 | 47.7 | 58.0 | 44.8 | 51.2 | 62.7 | 59.6 | 67.5 | 62.7 | 25.5 | 27.1 | 18.9 | 29.2 | 20.7 | 30.4 | 27.4 | 25.7 | 72.1 | 74.7 | 56.3 | 58.6 | 43.5 | 45.1 | 66.5 | 82.5 | 67.0 | 64.4 | 71.0 | 84.7 | 77.5 | 66.4 | 54.2 | 54.1 |
| Black | 23.1 | 28.2 | 18.4 | 14.5 | 13.6 | 20.7 | 28.6 | 32.7 | 17.7 | 27.9 | 6.0 | 6.2 | 8.0 | 5.5 | 6.2 | 6.0 | 5.7 | 6.6 | 17.5 | 16.3 | 5.1 | 3.9 | 36.5 | 38.3 | 7.4 | 2.3 | 9.2 | 10.2 | 6.2 | 2.2 | 10.3 | 18.6 | 35.4 | 36.8 |
| Latinx | 11.9 | 12.8 | 22.7 | 21.0 | 25.2 | 21.1 | 4.7 | 4.8 | 10.2 | 6.2 | 49.1 | 52.0 | 57.3 | 49.0 | 55.0 | 48.6 | 48.3 | 54.4 | 3.7 | 4.3 | 30.6 | 31.7 | 11.6 | 11.3 | 17.6 | 9.7 | 14.2 | 19.0 | 16.2 | 6.9 | 5.3 | 10.7 | 6.0 | 5.6 |
| Native American | 2.7 | 0.7 | 0.1 | 0.2 | 0.3 | 0.7 | 0.9 | 1.6 | 0.8 | 0.6 | 0.5 | 0.7 | 0.4 | 0.7 | 0.4 | 0.8 | 0.4 | 0.9 | 0.1 | 0.1 | 0.8 | 0.7 | 0.2 | 0.2 | 1.1 | 1.8 | 0.2 | 0.3 | 1.2 | 4.3 | 0.1 | 0.1 | 0.3 | 0.3 |
| Asian | 2.7 | 2.7 | 10.1 | 5.3 | 15.0 | 5.0 | 1.8 | 0.4 | 1.5 | 1.3 | 15.2 | 10.8 | 12.1 | 12.1 | 14.8 | 10.3 | 14.6 | 9.3 | 2.5 | 1.1 | 3.7 | 2.2 | 5.2 | 2.1 | 2.9 | 0.5 | 6.9 | 3.7 | 2.3 | 0.4 | 4.9 | 2.3 | 1.4 | 1.1 |
| Other Race | 3.5 | 3.5 | 1.0 | 1.2 | 1.1 | 1.3 | 1.3 | 1.0 | 2.2 | 1.3 | 3.8 | 3.3 | 3.1 | 3.5 | 2.8 | 3.9 | 3.6 | 3.3 | 4.1 | 3.5 | 3.6 | 2.9 | 3.0 | 3.0 | 4.6 | 3.2 | 2.5 | 2.4 | 3.0 | 1.5 | 1.9 | 1.8 | 2.7 | 2.1 |
| School Type | ||||||||||||||||||||||||||||||||||
| 0/1 is a Charter School | 0.02 | 0.08 | 0.04 | 0.06 | 0.00 | 0.04 | 0.00 | 0.00 | 0.06 | 0.04 | 0.08 | 0.32 | 0.06 | 0.31 | 0.08 | 0.34 | 0.09 | 0.38 | 0.02 | 0.18 | 0.08 | 0.19 | 0.05 | 0.04 | 0.00 | 0.01 | 0.10 | 0.09 | 0.00 | 0.00 | 0.02 | 0.13 | 0.05 | 0.12 |
| 0/1 is a Magnet School | 0.02 | 0.04 | 0.00 | 0.00 | 0.03 | 0.01 | 0.04 | 0.03 | 0.01 | 0.02 | 0.11 | 0.10 | 0.15 | 0.09 | 0.16 | 0.08 | 0.14 | 0.08 | 0.00 | 0.00 | 0.01 | 0.01 | 0.09 | 0.08 | 0.01 | 0.00 | 0.00 | 0.00 | 0.00 | 0.00 | 0.01 | 0.00 | 0.19 | 0.12 |
| 0/1 is a Regular School | 0.96 | 0.88 | 0.96 | 0.94 | 0.96 | 0.94 | 0.96 | 0.97 | 0.93 | 0.94 | 0.81 | 0.58 | 0.78 | 0.60 | 0.75 | 0.59 | 0.77 | 0.55 | 0.98 | 0.82 | 0.91 | 0.80 | 0.86 | 0.88 | 0.99 | 0.99 | 0.90 | 0.91 | 1.00 | 1.00 | 0.97 | 0.87 | 0.76 | 0.75 |
| Locale | ||||||||||||||||||||||||||||||||||
| In a City | 0.13 | 0.28 | 0.13 | 0.08 | 0.31 | 0.47 | 0.19 | 0.10 | 0.08 | 0.11 | 0.46 | 0.40 | 0.44 | 0.41 | 0.41 | 0.42 | 0.43 | 0.41 | 0.18 | 0.22 | 0.36 | 0.20 | 0.16 | 0.20 | 0.13 | 0.06 | 0.15 | 0.20 | 0.08 | 0.07 | 0.12 | 0.23 | 0.15 | 0.12 |
| In a Suburb | 0.16 | 0.19 | 0.78 | 0.76 | 0.62 | 0.12 | 0.19 | 0.06 | 0.08 | 0.04 | 0.46 | 0.36 | 0.50 | 0.36 | 0.53 | 0.33 | 0.50 | 0.31 | 0.43 | 0.18 | 0.31 | 0.11 | 0.42 | 0.27 | 0.07 | 0.01 | 0.67 | 0.64 | 0.04 | 0.00 | 0.66 | 0.27 | 0.31 | 0.21 |
| In a Town | 0.17 | 0.11 | 0.01 | 0.04 | 0.02 | 0.10 | 0.14 | 0.13 | 0.33 | 0.07 | 0.05 | 0.10 | 0.03 | 0.11 | 0.02 | 0.12 | 0.04 | 0.13 | 0.14 | 0.17 | 0.15 | 0.11 | 0.17 | 0.16 | 0.26 | 0.10 | 0.02 | 0.04 | 0.17 | 0.07 | 0.11 | 0.14 | 0.13 | 0.14 |
| In a Rural Area | 0.54 | 0.41 | 0.08 | 0.12 | 0.05 | 0.31 | 0.49 | 0.72 | 0.51 | 0.78 | 0.03 | 0.13 | 0.03 | 0.13 | 0.04 | 0.14 | 0.04 | 0.15 | 0.25 | 0.42 | 0.18 | 0.59 | 0.25 | 0.36 | 0.54 | 0.83 | 0.16 | 0.12 | 0.71 | 0.87 | 0.10 | 0.36 | 0.41 | 0.52 |
Note: Schools that satisfied the following criteria were included in the sample: offers grades 9-12 and enrolls at least ten students in each grade; located in the 50 U.S. states, the District of Columbia, or land regulated by the Bureau of Indian Affairs; is not a special education school, alternative school, virtual school, or independent school; is an open status school and reports enrollment to the Federal Department of Education.
Cross-university results, in-state
Probability of in-state public high school receiving a visit
| NC State | Rutgers | Stony Brook | Alabama | Arkansas | UC Berkeley | UC Irvine | UC Riverside | UC San Diego | Cincinnati | CU Boulder | Georgia | Kansas | UMass | Nebraska | Pittsburgh | S.Carolina | |
|---|---|---|---|---|---|---|---|---|---|---|---|---|---|---|---|---|---|
| Income (ref=<$50k) | |||||||||||||||||
| $50k-$74k | -0.131** (0.042) | -0.153 (0.106) | -0.025 (0.021) | -0.043 (0.057) | 0.038 (0.078) | 0.089*** (0.023) | -0.056* (0.024) | -0.028 (0.024) | 0.048 (0.026) | 0.090* (0.035) | 0.147* (0.060) | -0.058 (0.062) | 0.079 (0.070) | 0.181 (0.103) | -0.020 (0.076) | 0.007 (0.034) | 0.143* (0.059) |
| $75k-$99k | 0.081 (0.102) | -0.140 (0.114) | -0.023 (0.035) | 0.018 (0.118) | 0.144 (0.274) | 0.137*** (0.030) | -0.059* (0.030) | -0.051 (0.031) | 0.130*** (0.036) | 0.319*** (0.051) | 0.164* (0.077) | -0.009 (0.115) | 0.254*** (0.073) | 0.114 (0.111) | -0.115 (0.107) | 0.203*** (0.056) | 0.191* (0.093) |
| $100k-$149k | -0.145 (0.135) | -0.067 (0.121) | 0.112*** (0.031) | 0.129** (0.044) | -0.092* (0.041) | -0.053 (0.042) | 0.165*** (0.048) | 0.420*** (0.064) | 0.129 (0.085) | 0.096 (0.133) | 0.264** (0.093) | 0.206 (0.112) | -0.049 (0.104) | 0.323*** (0.074) | 0.274** (0.105) | ||
| $150k-$199k | 0.131 (0.146) | 0.347*** (0.087) | 0.305** (0.094) | -0.251*** (0.062) | -0.114 (0.085) | 0.366*** (0.069) | 0.433*** (0.118) | 0.288* (0.141) | 0.422*** (0.126) | ||||||||
| $200k+ | 0.192 (0.156) | -0.009 (0.175) | -0.137 (0.130) | -0.292*** (0.056) | -0.056 (0.128) | 0.229 (0.159) | -0.625*** (0.137) | ||||||||||
| BL, LX, NA Enrollment (ref=<20%) | |||||||||||||||||
| 20-39% | -0.157** (0.059) | 0.079 (0.072) | 0.165*** (0.038) | -0.042 (0.061) | -0.157 (0.084) | 0.019 (0.045) | 0.019 (0.032) | -0.056 (0.044) | -0.027 (0.043) | 0.098 (0.058) | -0.021 (0.052) | 0.045 (0.078) | 0.016 (0.070) | 0.024 (0.085) | 0.052 (0.056) | 0.034 (0.062) | 0.155 (0.089) |
| 40-59% | -0.064 (0.073) | 0.189* (0.093) | 0.143* (0.055) | -0.084 (0.083) | -0.123 (0.110) | 0.089 (0.047) | 0.088* (0.034) | -0.078 (0.044) | -0.069 (0.048) | 0.058 (0.072) | 0.051 (0.076) | 0.063 (0.083) | -0.009 (0.107) | 0.033 (0.119) | -0.172 (0.133) | -0.043 (0.073) | 0.090 (0.093) |
| 60-79% | -0.068 (0.077) | 0.252** (0.087) | 0.063 (0.061) | 0.054 (0.103) | -0.041 (0.191) | 0.063 (0.047) | 0.116** (0.038) | -0.035 (0.046) | -0.014 (0.048) | 0.020 (0.082) | -0.032 (0.079) | 0.134 (0.098) | -0.003 (0.116) | 0.053 (0.132) | -0.136 (0.200) | -0.179* (0.085) | 0.158 (0.119) |
| 80-89% | -0.117 (0.107) | 0.073 (0.154) | -0.009 (0.060) | 0.051 (0.130) | -0.320 (0.171) | 0.111* (0.051) | 0.124** (0.047) | 0.027 (0.055) | 0.097 (0.059) | 0.039 (0.079) | 0.130 (0.108) | -0.064 (0.112) | 0.132 (0.097) | -0.088 (0.146) | -0.272 (0.144) | -0.107 (0.082) | 0.420** (0.131) |
| 90%+ | -0.108 (0.086) | 0.100 (0.113) | -0.116* (0.055) | -0.241*** (0.066) | -0.136 (0.168) | 0.237*** (0.050) | 0.192*** (0.043) | 0.042 (0.052) | 0.025 (0.055) | 0.249*** (0.074) | -0.054 (0.103) | 0.248* (0.104) | -0.172 (0.152) | -0.217 (0.298) | 0.003 (0.067) | 0.122 (0.132) | |
| # Math Proficient Students (ref=<50) | |||||||||||||||||
| 50-99 | 0.006 (0.061) | 0.112 (0.067) | 0.043* (0.018) | 0.096 (0.101) | 0.222 (0.122) | 0.002 (0.033) | 0.045 (0.036) | 0.036 (0.037) | 0.203*** (0.044) | 0.106* (0.053) | 0.118 (0.072) | 0.155 (0.080) | -0.068 (0.049) | 0.171 (0.102) | 0.064 (0.069) | 0.006 (0.037) | 0.157 (0.162) |
| 100-199 | 0.071 (0.093) | 0.156* (0.077) | 0.134*** (0.039) | 0.385** (0.121) | -0.004 (0.196) | 0.114** (0.044) | 0.037 (0.045) | 0.111* (0.047) | 0.338*** (0.052) | 0.066 (0.071) | 0.153* (0.065) | 0.281** (0.098) | -0.179* (0.071) | 0.317* (0.138) | 0.001 (0.111) | 0.213*** (0.056) | 0.181 (0.231) |
| 200-299 | 0.097 (0.148) | 0.308*** (0.085) | 0.182* (0.089) | 0.241 (0.171) | 0.355 (0.199) | 0.153* (0.061) | 0.125* (0.062) | 0.148* (0.066) | 0.410*** (0.066) | -0.023 (0.108) | 0.097 (0.087) | 0.321* (0.142) | -0.236* (0.095) | 0.335 (0.179) | 0.001 (0.173) | 0.369*** (0.089) | 0.196 (0.255) |
| 300-399 | 0.017 (0.197) | 0.230 (0.179) | 0.357** (0.116) | 0.126 (0.300) | 0.066 (0.094) | 0.171 (0.093) | 0.231* (0.099) | 0.334*** (0.098) | -0.059 (0.130) | 0.093 (0.075) | 0.494** (0.183) | 0.528* (0.212) | -0.096 (0.184) | 0.487*** (0.131) | 0.097 (0.282) | ||
| 400+ | 0.611 (0.391) | 0.410*** (0.124) | 0.599*** (0.157) | 0.367 (0.343) | 0.072 (0.139) | 0.231 (0.124) | 0.419*** (0.120) | 0.428*** (0.104) | -0.097 (0.135) | 0.088 (0.072) | 0.354 (0.220) | 0.618* (0.251) | -0.135 (0.227) | 0.548** (0.177) | 0.044 (0.301) | ||
| # G12 Students (ref=<50) | |||||||||||||||||
| 50-99 | 0.189** (0.058) | 0.087 (0.119) | -0.029 (0.019) | 0.165** (0.056) | 0.218** (0.080) | -0.022 (0.023) | -0.009 (0.019) | -0.042 (0.025) | 0.075* (0.030) | 0.115* (0.050) | 0.290*** (0.080) | 0.207** (0.077) | 0.163 (0.084) | 0.150 (0.117) | 0.107 (0.087) | 0.058 (0.035) | 0.323* (0.150) |
| 100-199 | 0.308*** (0.057) | 0.229* (0.113) | -0.045 (0.035) | 0.274*** (0.064) | 0.252* (0.116) | 0.021 (0.025) | -0.009 (0.022) | -0.028 (0.028) | 0.010 (0.028) | 0.336*** (0.071) | 0.436*** (0.098) | 0.191** (0.072) | 0.391*** (0.071) | 0.059 (0.135) | 0.217 (0.118) | 0.068 (0.047) | 0.493* (0.224) |
| 200-299 | 0.328*** (0.080) | 0.240* (0.122) | 0.022 (0.080) | 0.685*** (0.105) | 0.325 (0.166) | 0.105** (0.035) | 0.046 (0.033) | 0.018 (0.036) | 0.079 (0.042) | 0.459*** (0.097) | 0.534*** (0.100) | 0.288** (0.088) | 0.461*** (0.081) | -0.043 (0.163) | 0.391* (0.168) | 0.110 (0.068) | 0.488* (0.246) |
| 300-399 | 0.398*** (0.105) | 0.291* (0.119) | -0.083 (0.103) | 0.429** (0.136) | 0.172*** (0.041) | 0.121** (0.042) | 0.065 (0.048) | 0.133** (0.051) | 0.610*** (0.119) | 0.554*** (0.092) | 0.398*** (0.104) | 0.554*** (0.088) | 0.061 (0.191) | 0.409* (0.190) | 0.142 (0.091) | 0.576* (0.259) | |
| 400-499 | 0.277 (0.143) | 0.243 (0.136) | -0.279 (0.150) | 0.477** (0.169) | 0.635** (0.195) | 0.098* (0.043) | 0.112* (0.044) | 0.115* (0.051) | 0.187*** (0.053) | 0.715*** (0.128) | 0.552*** (0.099) | 0.365** (0.130) | 0.597*** (0.098) | 0.050 (0.219) | 0.451* (0.186) | 0.105 (0.140) | 0.691* (0.285) |
| 500+ | 0.299 (0.207) | 0.276 (0.143) | -0.129 (0.168) | 0.763*** (0.169) | 0.602* (0.273) | 0.227*** (0.044) | 0.185*** (0.046) | 0.244*** (0.055) | 0.198*** (0.055) | 0.452** (0.163) | 0.498*** (0.115) | 0.260 (0.146) | 0.665*** (0.129) | -0.117 (0.320) | 0.589* (0.233) | 0.268 (0.166) | 0.741* (0.303) |
| Locale (ref=suburb) | |||||||||||||||||
| City | -0.070 (0.063) | 0.122 (0.097) | -0.218*** (0.049) | -0.210* (0.095) | -0.301 (0.193) | 0.012 (0.024) | -0.037 (0.024) | -0.055* (0.025) | -0.009 (0.026) | 0.021 (0.059) | 0.087 (0.061) | -0.061 (0.076) | 0.075 (0.069) | 0.033 (0.085) | -0.020 (0.071) | 0.049 (0.056) | 0.095 (0.084) |
| Rural | 0.114* (0.056) | -0.125 (0.081) | -0.090* (0.039) | -0.162 (0.093) | -0.044 (0.174) | -0.068* (0.030) | -0.072* (0.031) | -0.044 (0.032) | -0.038 (0.037) | -0.127** (0.044) | -0.130 (0.072) | -0.009 (0.072) | 0.142* (0.067) | 0.034 (0.080) | 0.273* (0.126) | -0.173*** (0.045) | 0.085 (0.071) |
| Town | 0.162* (0.073) | -0.205 (0.151) | -0.119** (0.039) | -0.214* (0.105) | 0.233 (0.165) | -0.031 (0.036) | -0.084** (0.032) | -0.052 (0.030) | -0.027 (0.039) | -0.025 (0.050) | 0.036 (0.091) | 0.122 (0.087) | 0.229** (0.074) | -0.130 (0.182) | 0.214 (0.128) | -0.036 (0.058) | 0.011 (0.102) |
| School Type (ref=regular school) | |||||||||||||||||
| Charter | -0.071 (0.069) | -0.063 (0.122) | 0.051 (0.034) | 0.250 (0.161) | -0.071** (0.023) | -0.071** (0.024) | -0.069** (0.027) | -0.042 (0.028) | -0.181*** (0.052) | -0.169 (0.094) | 0.136 (0.116) | -0.401*** (0.114) | 0.217* (0.094) | -0.072 (0.046) | 0.214 (0.127) | ||
| Magnet | -0.055 (0.092) | 0.217** (0.072) | 0.105 (0.129) | 0.042 (0.292) | -0.044 (0.036) | -0.006 (0.040) | 0.034 (0.042) | 0.028 (0.040) | 0.354 (0.197) | 0.016 (0.091) | 0.141 (0.140) | 0.376 (0.255) | 0.020 (0.067) | ||||
| Distance (in 10 miles) | -0.010** (0.004) | -0.006 (0.014) | -0.016*** (0.001) | -0.004 (0.005) | 0.004 (0.006) | -0.008*** (0.001) | -0.0001 (0.001) | -0.007*** (0.001) | -0.002* (0.001) | -0.018*** (0.002) | -0.002 (0.005) | -0.001 (0.005) | -0.005 (0.003) | -0.013 (0.010) | -0.005 (0.003) | -0.013*** (0.002) | -0.016* (0.008) |
| Constant | 0.195 (0.100) | 0.352 (0.181) | 0.423*** (0.045) | 0.313** (0.117) | 0.336 (0.193) | 0.125* (0.054) | 0.062 (0.053) | 0.378*** (0.062) | 0.108 (0.068) | 0.340*** (0.065) | 0.183 (0.107) | -0.066 (0.126) | 0.349*** (0.099) | 0.227 (0.157) | 0.657*** (0.164) | 0.276*** (0.058) | 0.027 (0.148) |
| Observations | 504 | 400 | 1,156 | 341 | 237 | 1,404 | 1,404 | 1,404 | 1,404 | 817 | 313 | 418 | 317 | 348 | 247 | 652 | 209 |
| Akaike Inf. Crit. | 575.111 | 541.538 | 309.407 | 365.633 | 328.378 | 1,139.351 | 1,033.907 | 1,150.074 | 1,390.132 | 798.304 | 252.223 | 564.266 | 373.616 | 475.712 | 166.755 | 480.002 | 215.891 |
Note: *p<0.05; **p<0.01; ***p<0.001; Robust standard errors in parentheses. Schools that satisfied the following criteria were included in the sample: offers grades 9-12 and enrolls at least ten students in each grade; located in the 50 U.S. states, the District of Columbia, or land regulated by the Bureau of Indian Affairs; is not a special education school, alternative school, virtual school, or independent school; is an open status school and reports enrollment to the Federal Department of Education.
Cross-university results, in-state
Descriptive statistics for community college visits
| NC State | Rutgers | Stony Brook | Alabama | Arkansas | UC Berkeley | UC Irvine | UC Riverside | UC San Diego | Cincinnati | CU Boulder | Georgia | Kansas | UMass | Nebraska | Pittsburgh | S.Carolina | ||||||||||||||||||
|---|---|---|---|---|---|---|---|---|---|---|---|---|---|---|---|---|---|---|---|---|---|---|---|---|---|---|---|---|---|---|---|---|---|---|
| Visit | Nonvisit | Visit | Nonvisit | Visit | Nonvisit | Visit | Nonvisit | Visit | Nonvisit | Visit | Nonvisit | Visit | Nonvisit | Visit | Nonvisit | Visit | Nonvisit | Visit | Nonvisit | Visit | Nonvisit | Visit | Nonvisit | Visit | Nonvisit | Visit | Nonvisit | Visit | Nonvisit | Visit | Nonvisit | Visit | Nonvisit | |
| Number of Colleges | 43 | 17 | 18 | 6 | 10 | 61 | 23 | 3 | 14 | 10 | 96 | 31 | 98 | 29 | 111 | 16 | 94 | 33 | 15 | 60 | 14 | 3 | 1 | 26 | 15 | 11 | 15 | 13 | 6 | 2 | 10 | 39 | 11 | 10 |
| Percent of Colleges | 71.7 | 28.3 | 75.0 | 25.0 | 14.1 | 85.9 | 88.5 | 11.5 | 58.3 | 41.7 | 75.6 | 24.4 | 77.2 | 22.8 | 87.4 | 12.6 | 74.0 | 26.0 | 20.0 | 80.0 | 82.4 | 17.6 | 3.7 | 96.3 | 57.7 | 42.3 | 53.6 | 46.4 | 75.0 | 25.0 | 20.4 | 79.6 | 52.4 | 47.6 |
| Miles from University | 111 | 97 | 38 | 27 | 44 | 175 | 105 | 119 | 148 | 149 | 236 | 244 | 190 | 223 | 208 | 143 | 242 | 265 | 155 | 149 | 94 | 76 | 34 | 113 | 159 | 135 | 59 | 63 | 136 | 146 | 143 | 136 | 71 | 69 |
| Enrollment by FTE | 3,403 | 2,150 | 6,463 | 364 | 12,415 | 1,931 | 2,664 | 960 | 1,546 | 1,468 | 8,631 | 2,945 | 8,810 | 1,950 | 8,164 | 857 | 9,060 | 2,068 | 4,728 | 873 | 4,119 | 1,348 | 2,532 | 3,754 | 2,953 | 1,055 | 4,087 | 312 | 4,654 | 189 | 6,298 | 820 | 4,904 | 1,528 |
| Median Household Income ($000) | $50 | $48 | $97 | $100 | $109 | $67 | $40 | $58 | $43 | $43 | $82 | $63 | $82 | $63 | $79 | $66 | $83 | $62 | $49 | $58 | $56 | $48 | $51 | $42 | $55 | $56 | $79 | $91 | $46 | $47 | $77 | $65 | $44 | $41 |
| Percent Pell | 62.7 | 68.0 | 52.3 | 48.0 | 59.2 | 64.2 | 64.9 | 50.7 | 71.1 | 76.1 | 49.9 | 57.8 | 49.9 | 58.4 | 50.6 | 60.4 | 49.2 | 59.4 | 60.8 | 64.8 | 54.9 | 31.7 | 61.0 | 76.1 | 49.6 | 57.5 | 57.9 | 53.9 | 51.2 | 63.5 | 47.9 | 64.7 | 65.5 | 67.5 |
| Percent Enrollment by Race | ||||||||||||||||||||||||||||||||||
| Black, Latinx, Native American | 32.6 | 29.0 | 41.6 | 22.7 | 54.0 | 29.7 | 32.8 | 53.8 | 21.9 | 33.4 | 52.9 | 53.7 | 52.6 | 57.0 | 52.9 | 55.5 | 53.5 | 48.4 | 20.9 | 13.6 | 26.2 | 48.1 | 22.9 | 48.0 | 27.6 | 27.0 | 32.2 | 31.6 | 18.6 | 16.0 | 19.7 | 29.0 | 33.4 | 26.1 |
| White | 57.9 | 57.5 | 41.2 | 65.2 | 30.0 | 53.8 | 61.7 | 42.9 | 71.5 | 58.5 | 22.7 | 25.3 | 22.6 | 26.9 | 22.9 | 22.1 | 22.3 | 29.0 | 63.5 | 78.3 | 57.6 | 35.8 | 71.5 | 43.2 | 59.1 | 61.3 | 55.2 | 41.0 | 70.2 | 78.3 | 64.9 | 55.6 | 58.8 | 67.4 |
| Black | 21.0 | 19.2 | 15.6 | 10.6 | 19.7 | 14.5 | 27.8 | 49.5 | 12.5 | 25.5 | 4.9 | 6.3 | 4.9 | 6.9 | 5.0 | 6.0 | 5.0 | 5.4 | 14.2 | 10.8 | 5.4 | 9.1 | 7.1 | 39.7 | 11.7 | 12.2 | 11.1 | 23.5 | 4.6 | 0.0 | 11.5 | 18.7 | 27.3 | 21.6 |
| Latinx | 9.9 | 8.1 | 25.6 | 11.8 | 33.8 | 14.5 | 4.0 | 3.2 | 8.5 | 7.0 | 47.6 | 46.8 | 47.4 | 49.6 | 47.5 | 49.1 | 48.1 | 42.3 | 6.2 | 2.4 | 19.7 | 38.5 | 15.2 | 7.6 | 14.4 | 13.4 | 20.8 | 7.7 | 13.3 | 1.9 | 7.6 | 10.1 | 5.6 | 4.3 |
| Native American | 1.7 | 1.7 | 0.4 | 0.3 | 0.4 | 0.7 | 0.9 | 1.1 | 0.9 | 0.8 | 0.4 | 0.6 | 0.4 | 0.6 | 0.4 | 0.5 | 0.3 | 0.7 | 0.5 | 0.4 | 1.1 | 0.5 | 0.6 | 0.6 | 1.4 | 1.4 | 0.3 | 0.4 | 0.8 | 14.2 | 0.6 | 0.3 | 0.5 | 0.1 |
| Asian | 2.0 | 2.7 | 5.0 | 2.6 | 9.3 | 2.3 | 1.3 | 0.2 | 0.8 | 1.1 | 12.2 | 8.8 | 12.3 | 6.7 | 11.9 | 11.4 | 12.0 | 10.6 | 1.2 | 1.4 | 2.3 | 3.7 | 1.2 | 3.1 | 2.3 | 1.2 | 4.6 | 6.1 | 1.6 | 0.0 | 2.4 | 4.6 | 1.6 | 1.2 |
| Other Race | 7.5 | 10.7 | 12.2 | 9.5 | 6.7 | 14.1 | 4.3 | 3.2 | 5.8 | 7.1 | 12.2 | 12.2 | 12.5 | 9.3 | 12.3 | 11.0 | 12.3 | 12.0 | 14.5 | 6.7 | 13.9 | 12.3 | 4.3 | 5.6 | 11.0 | 10.6 | 8.1 | 21.4 | 9.5 | 5.7 | 13.0 | 10.8 | 6.2 | 5.3 |
| Locale | ||||||||||||||||||||||||||||||||||
| In a City | 0.23 | 0.18 | 0.11 | 0.00 | 0.40 | 0.16 | 0.30 | 0.33 | 0.07 | 0.30 | 0.46 | 0.29 | 0.47 | 0.24 | 0.42 | 0.38 | 0.47 | 0.27 | 0.33 | 0.12 | 0.36 | 0.67 | 0.00 | 0.35 | 0.13 | 0.18 | 0.33 | 0.00 | 0.50 | 0.00 | 0.20 | 0.13 | 0.36 | 0.20 |
| In a Suburb | 0.16 | 0.12 | 0.44 | 0.83 | 0.60 | 0.34 | 0.00 | 0.33 | 0.07 | 0.10 | 0.44 | 0.39 | 0.44 | 0.38 | 0.41 | 0.50 | 0.47 | 0.30 | 0.13 | 0.27 | 0.21 | 0.00 | 1.00 | 0.23 | 0.00 | 0.00 | 0.47 | 0.92 | 0.00 | 0.00 | 0.50 | 0.36 | 0.27 | 0.10 |
| In a Town | 0.28 | 0.24 | 0.06 | 0.00 | 0.00 | 0.16 | 0.35 | 0.00 | 0.50 | 0.40 | 0.02 | 0.13 | 0.01 | 0.17 | 0.04 | 0.12 | 0.01 | 0.15 | 0.20 | 0.22 | 0.36 | 0.00 | 0.00 | 0.23 | 0.60 | 0.64 | 0.07 | 0.00 | 0.50 | 0.00 | 0.10 | 0.21 | 0.09 | 0.40 |
| In a Rural Area | 0.33 | 0.47 | 0.39 | 0.17 | 0.00 | 0.33 | 0.35 | 0.33 | 0.36 | 0.20 | 0.08 | 0.19 | 0.08 | 0.21 | 0.13 | 0.00 | 0.05 | 0.27 | 0.33 | 0.40 | 0.07 | 0.33 | 0.00 | 0.19 | 0.27 | 0.18 | 0.13 | 0.08 | 0.00 | 1.00 | 0.20 | 0.31 | 0.27 | 0.30 |
Note: We define community college as any public, 2-year or public, less-than 2-year institution, which could be a campus of a Title IV institution.
Appendix
State Revenue and Tuition Revenue per FTE Student, 2003-04 to 2016-17
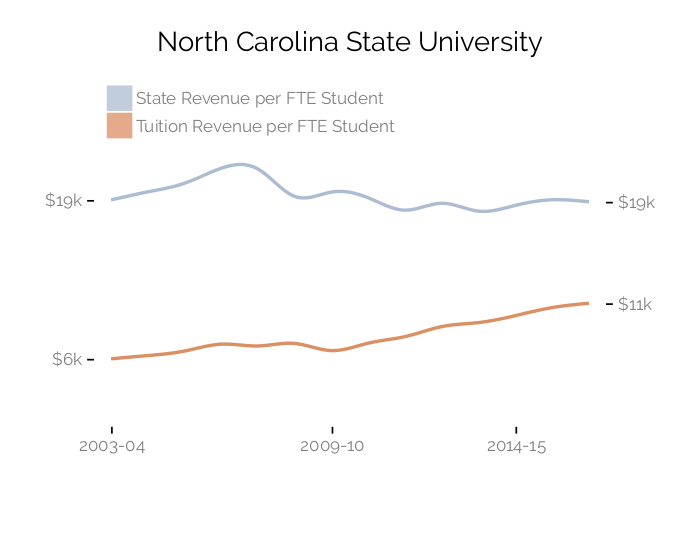

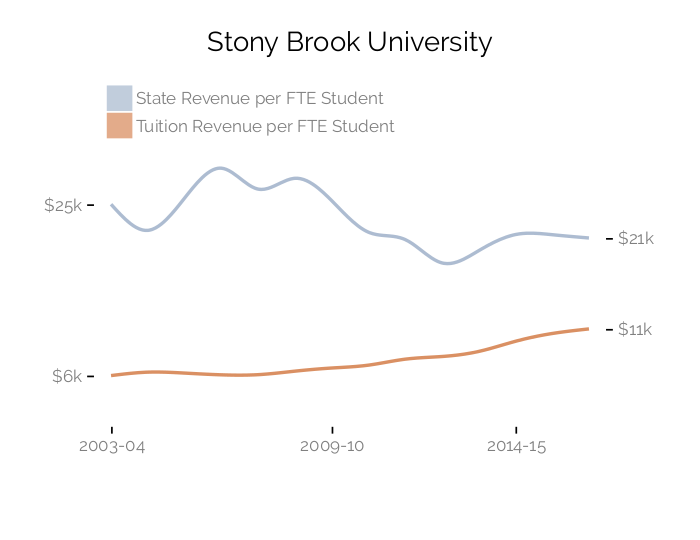
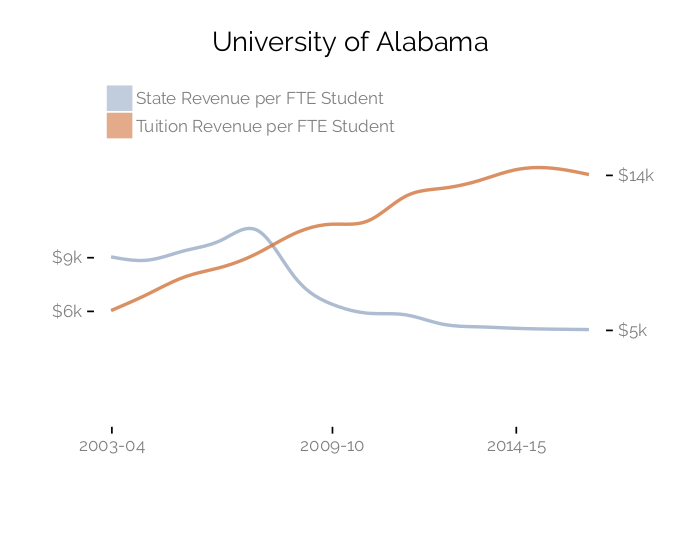
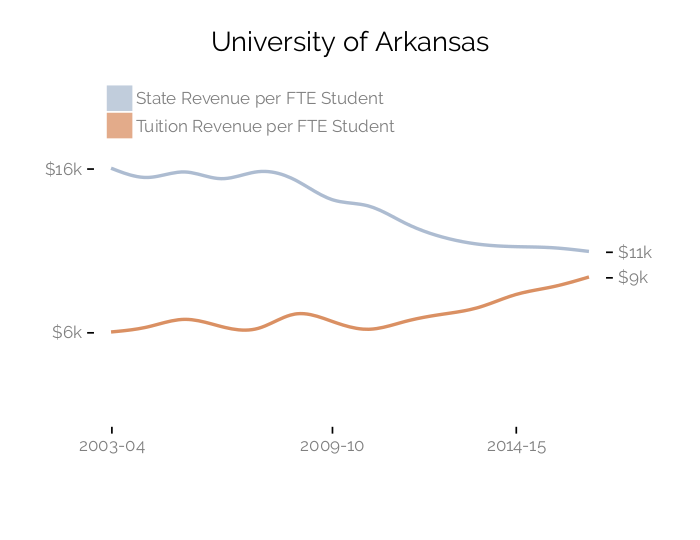
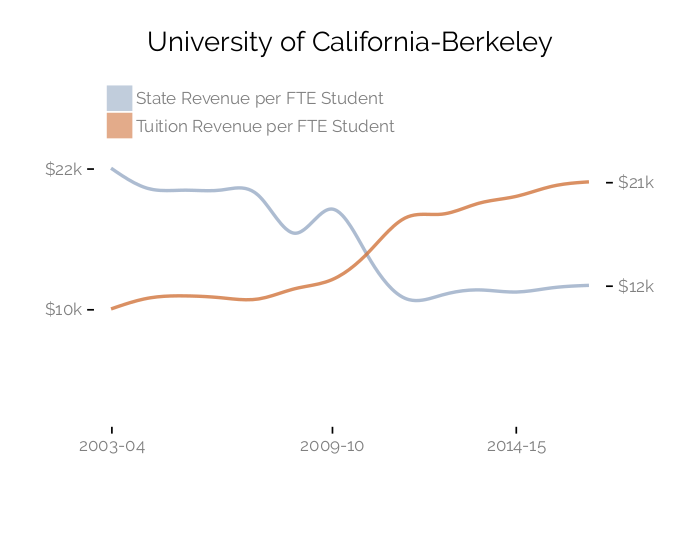
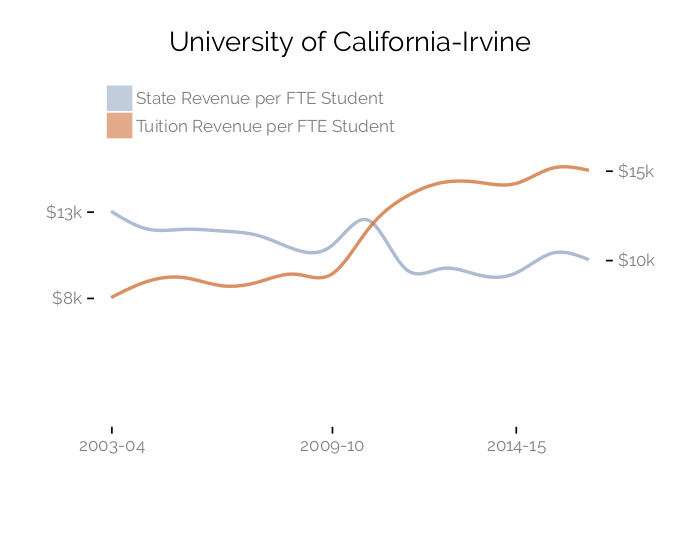
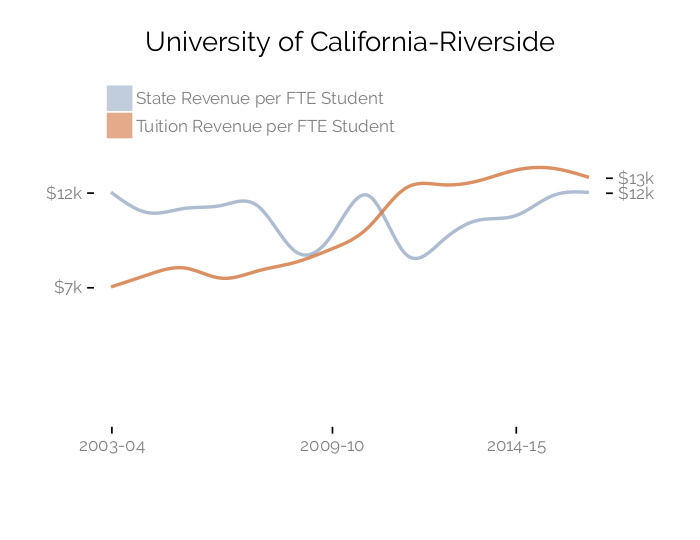
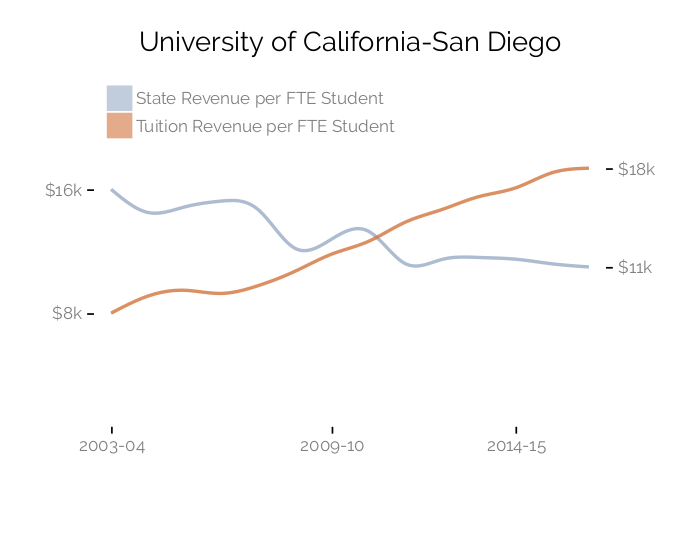
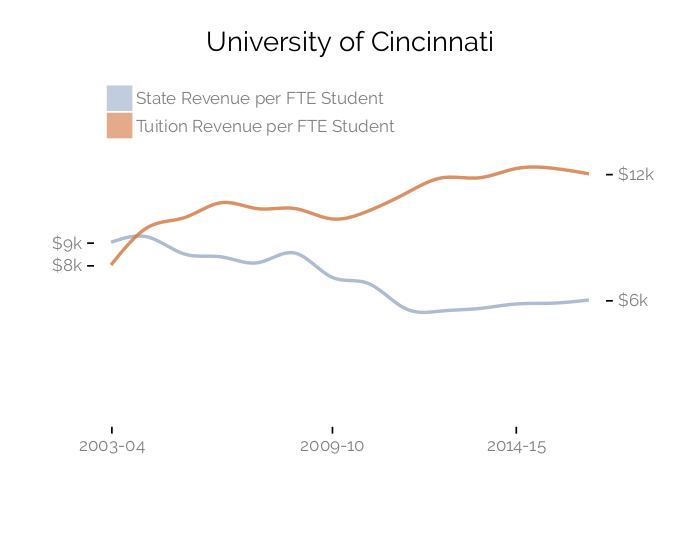
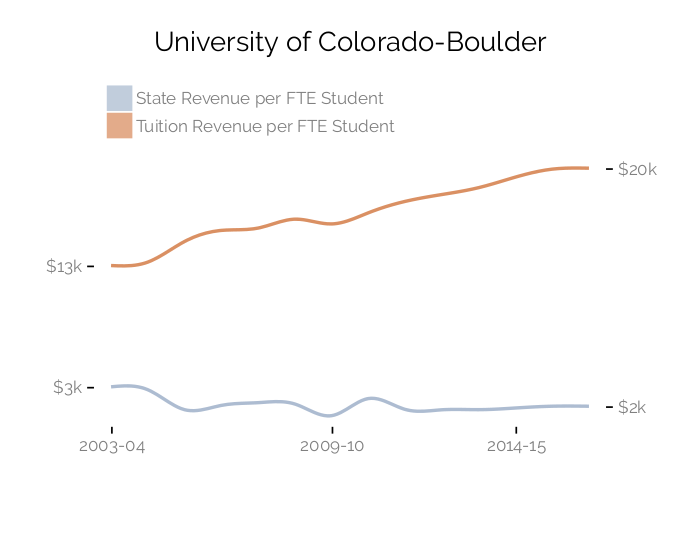
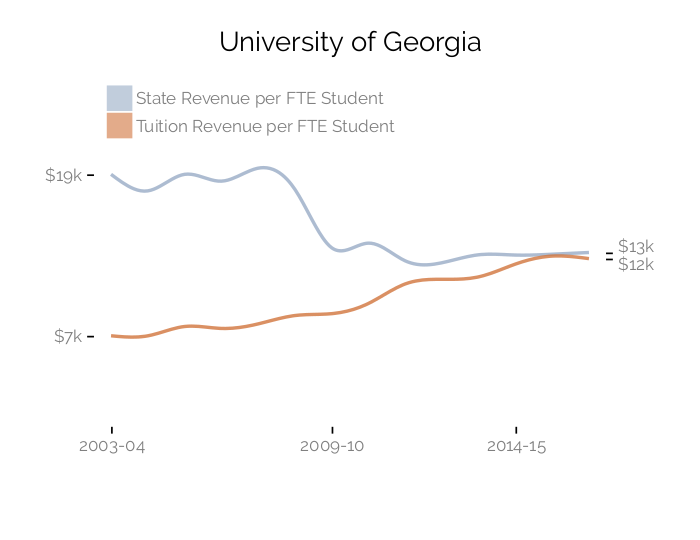
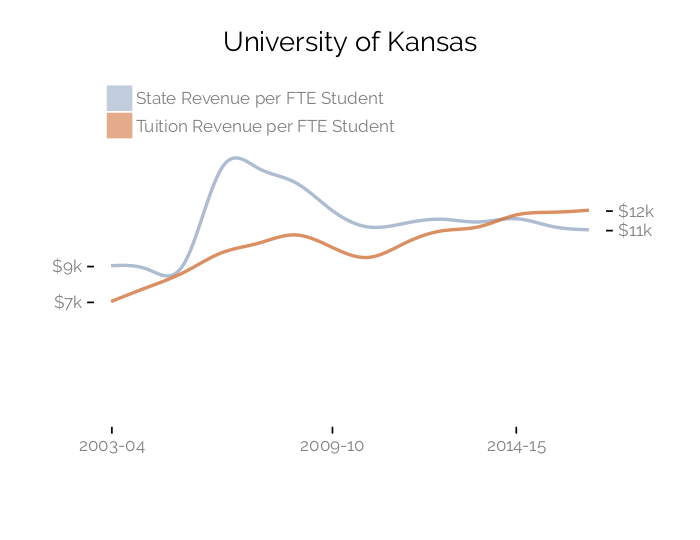
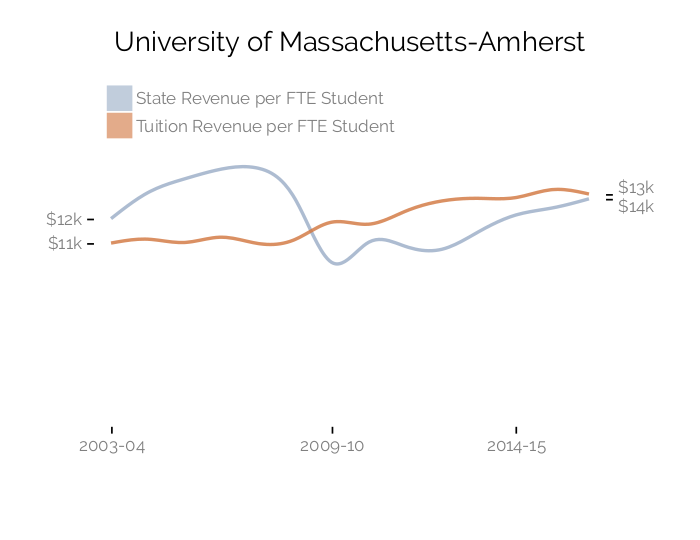
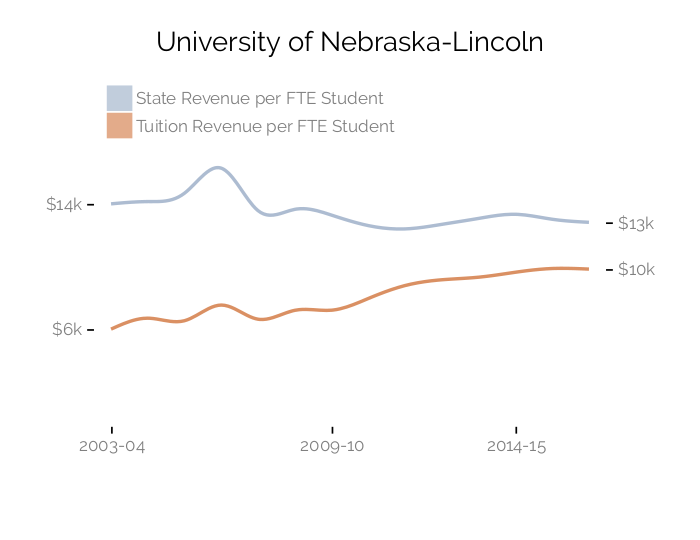
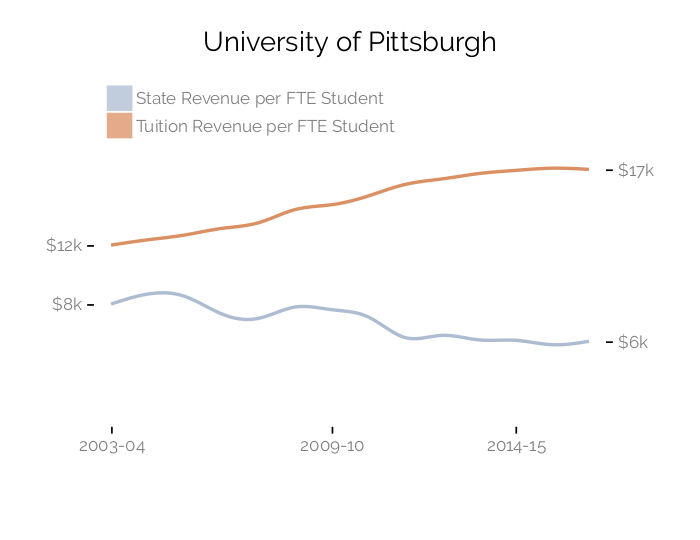
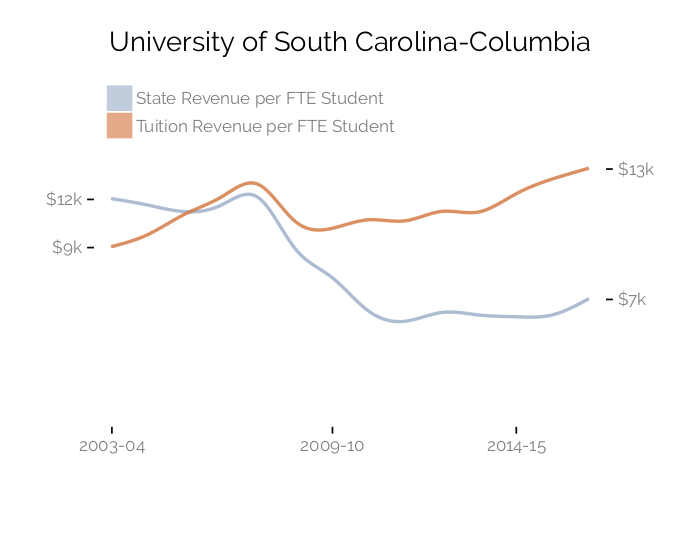
Note: FTE student count is based on reported full-time equivalent undergraduate enrollment; State revenue is the sum of state appropriations, operating grants and contracts, and non-operating grants; Tuition revenue is defined as revenue from tuition and fees after deducting discounts and allowances.
Appendix
Percent Out-of-State Freshmen and Federal Grant Recipient, 2003-04 to 2016-17
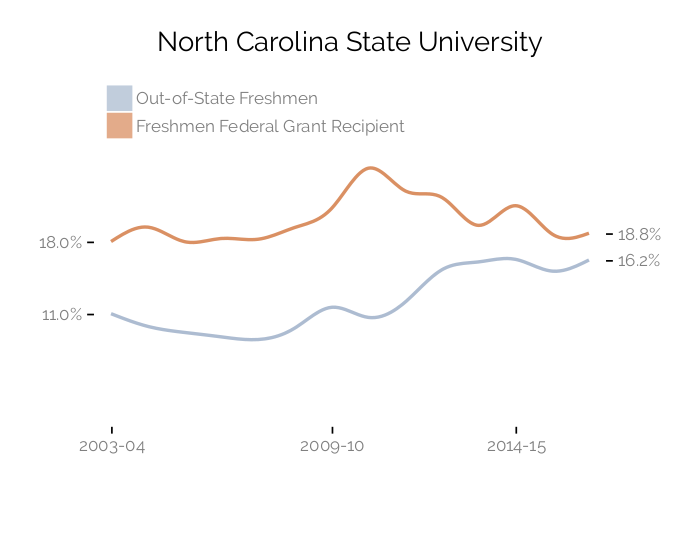
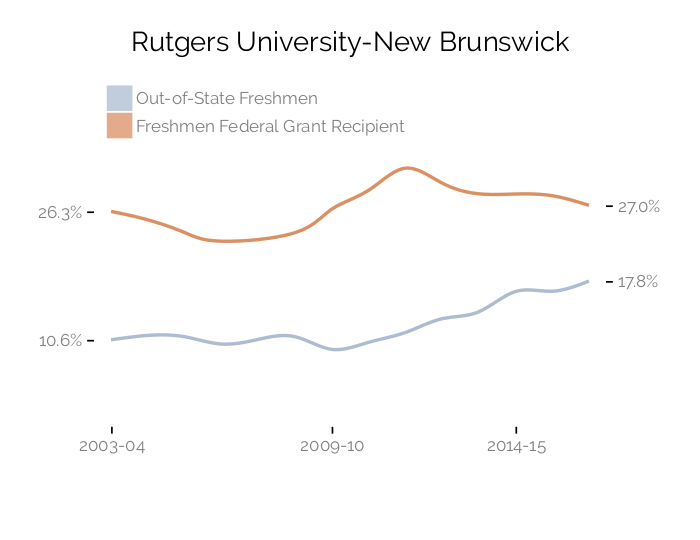
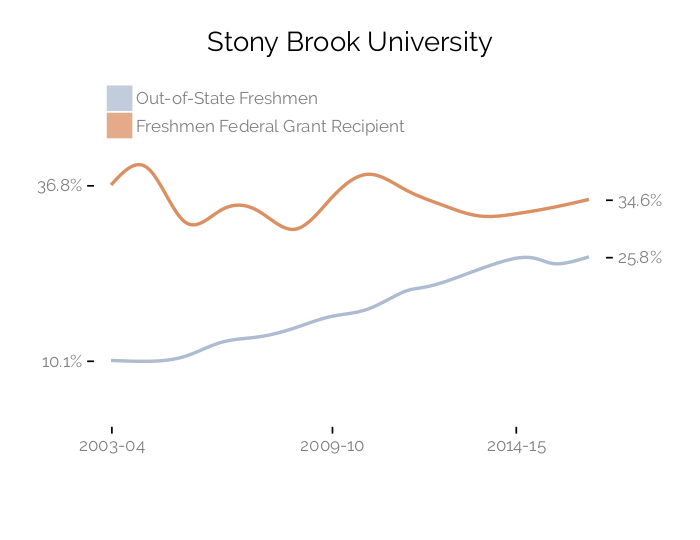
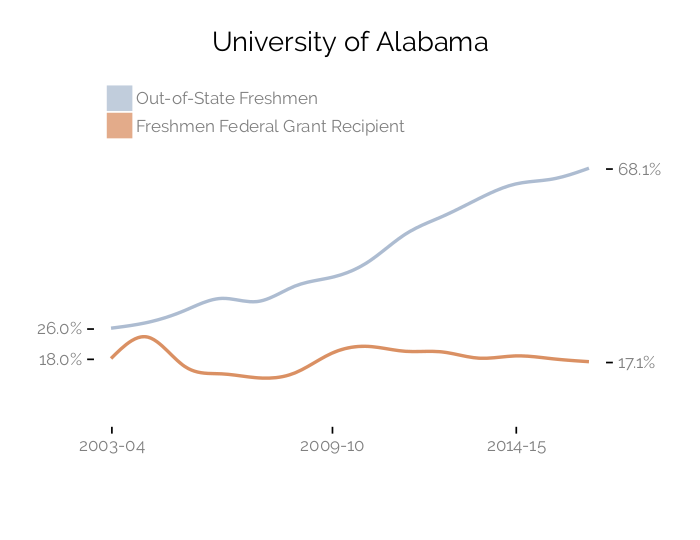
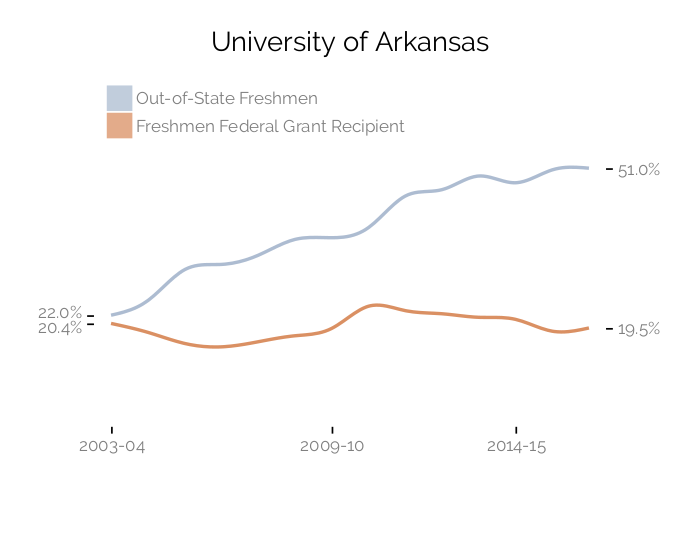
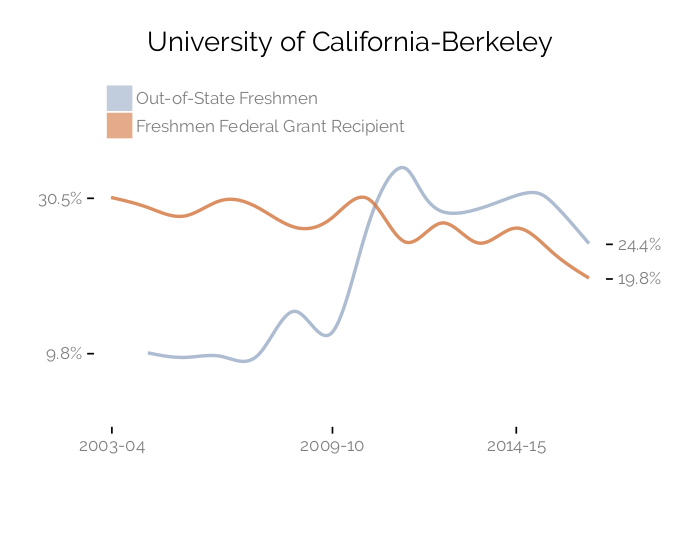
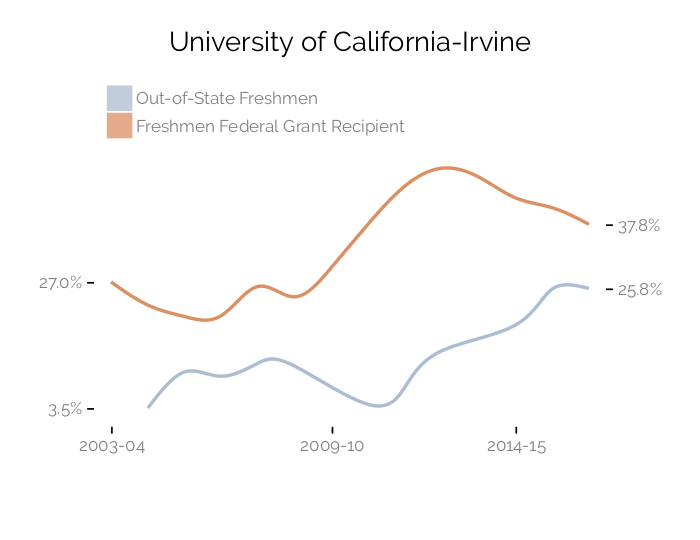
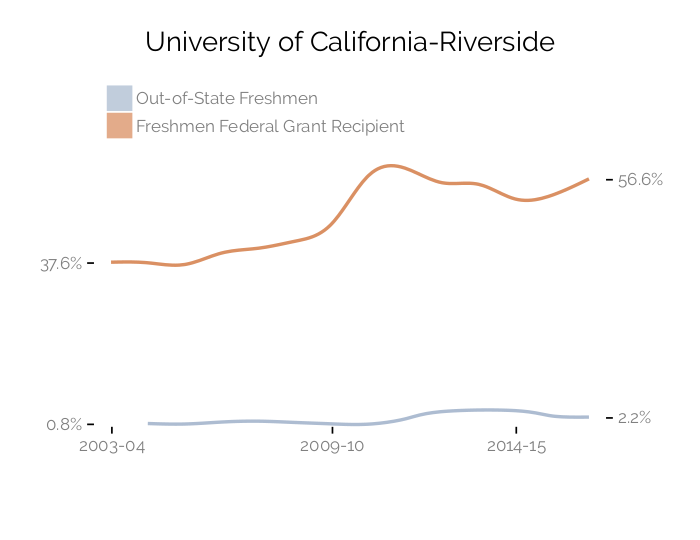
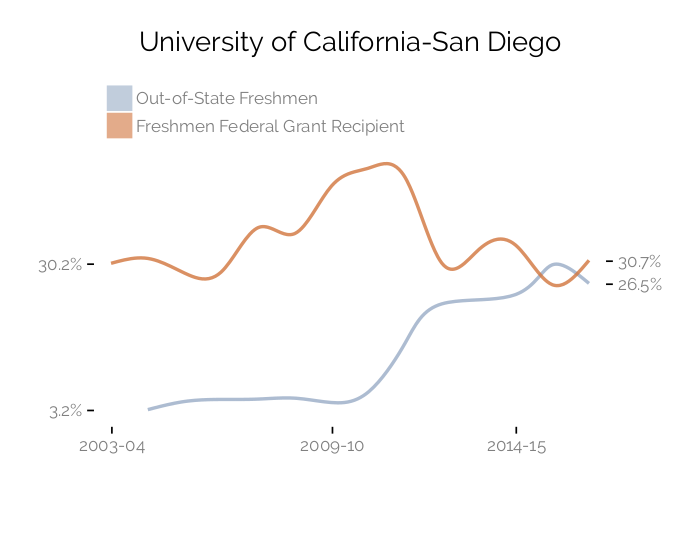
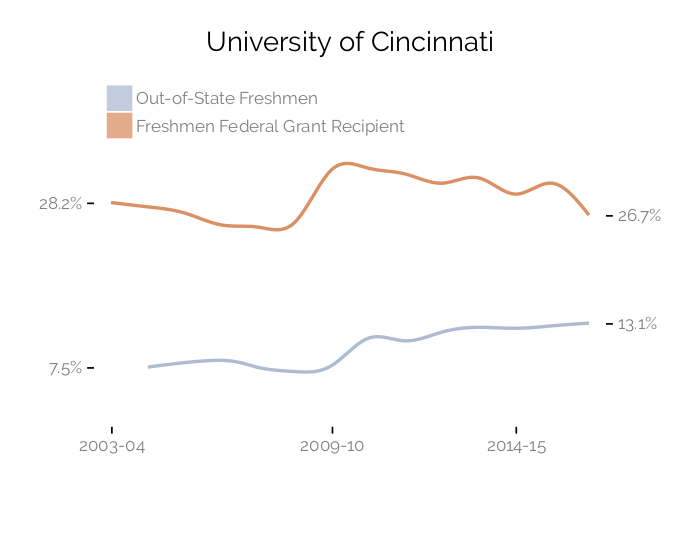
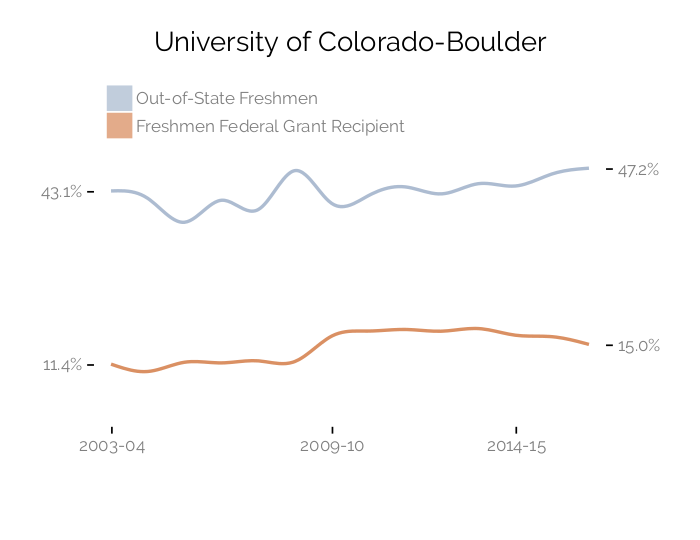
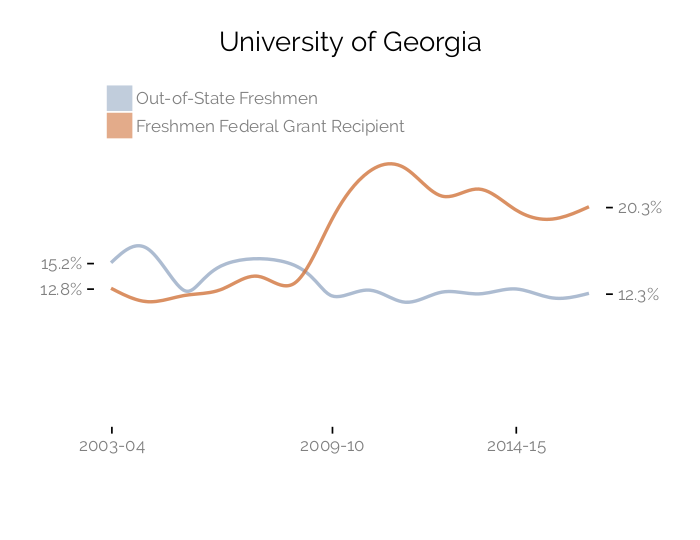
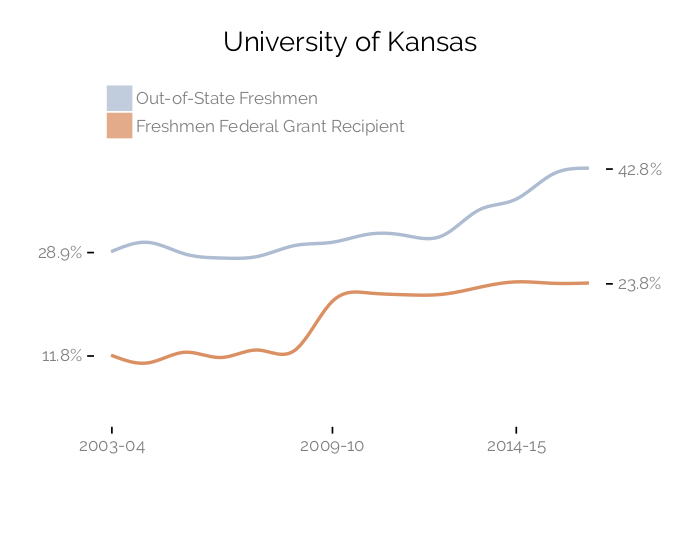
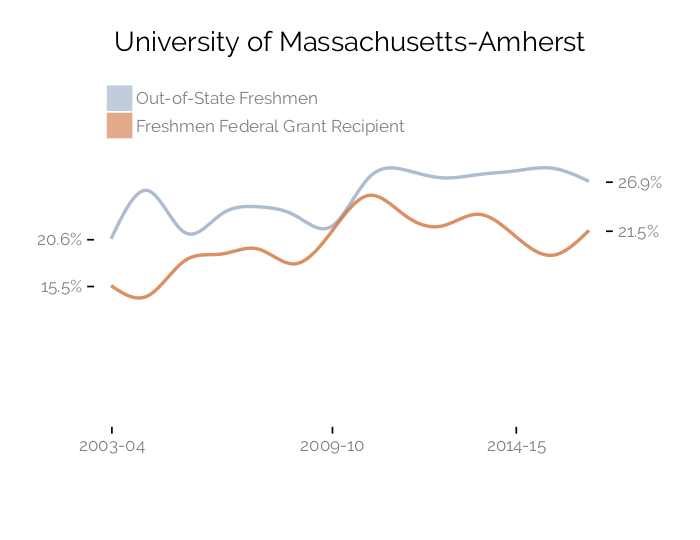
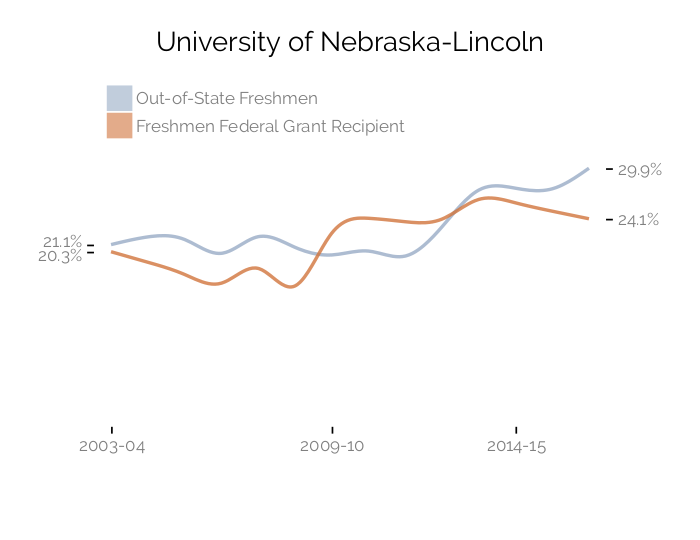
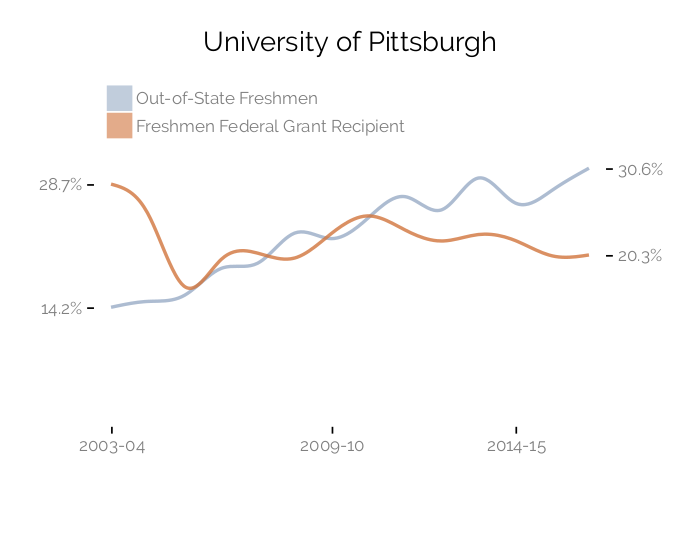
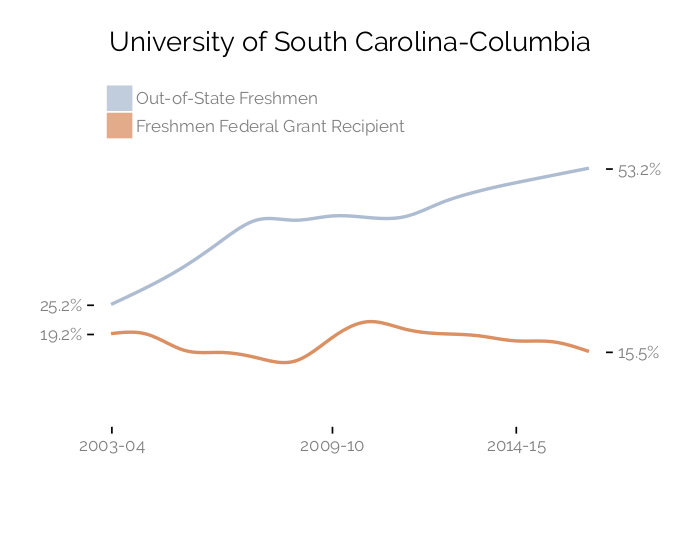
Note: Percent out-of-state freshmen is calculated for first-time degree-seeking undergraduate students based on state of residence at time of admission; Percent federal grant recipient is defined as percent of full-time, first-time degree-seeking undergraduates in full-year cohort who are awarded federal grant aids. 2007-08 federal grant recipient data for Rutgers University-New Brunswick is omitted due to concerns for data accuracy.
Appendix
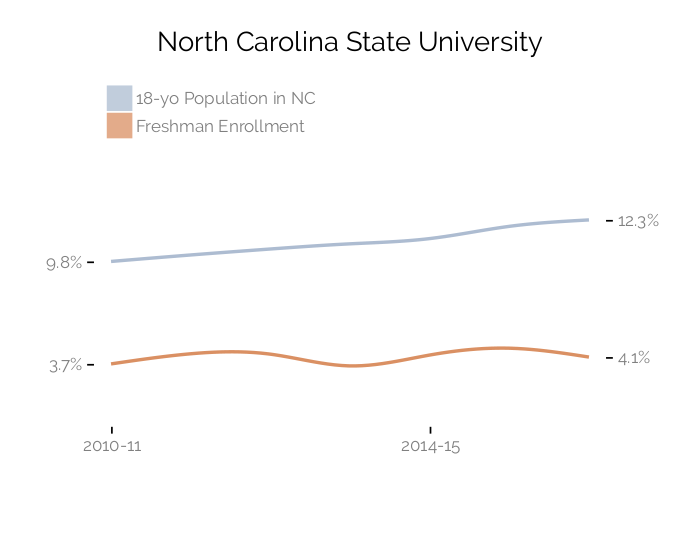
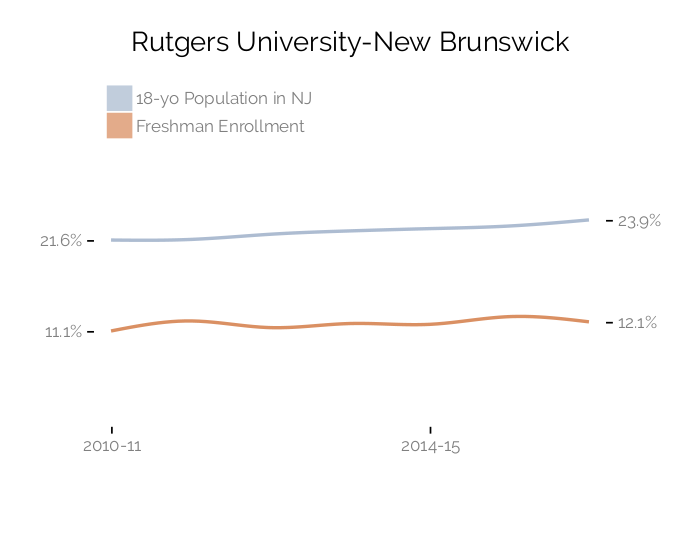
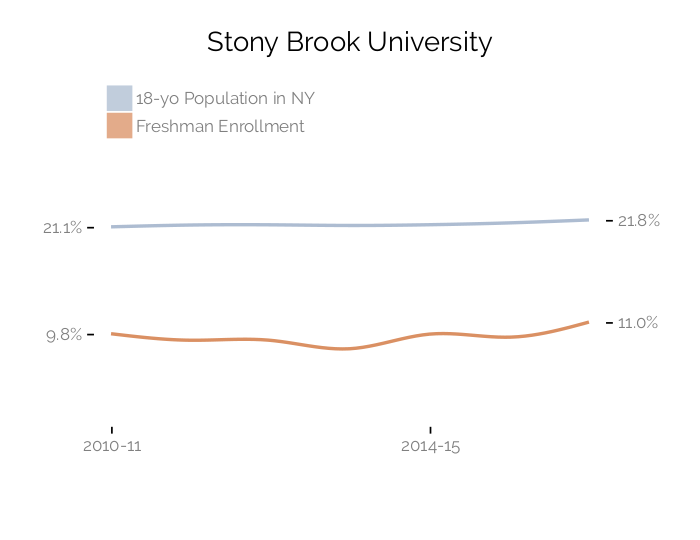
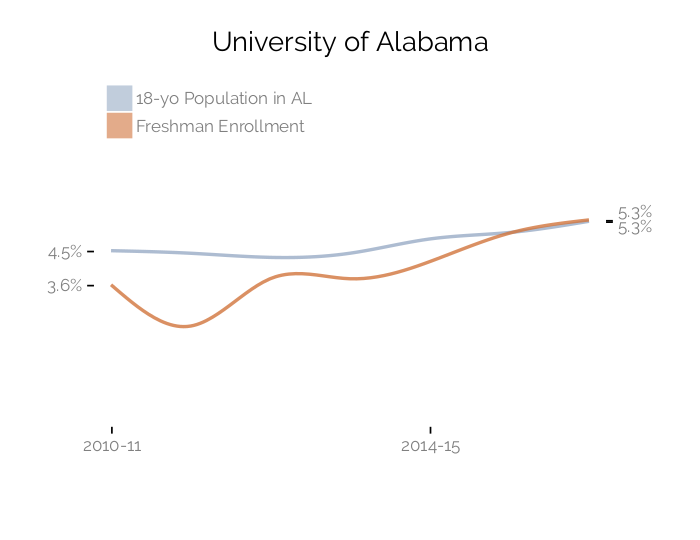
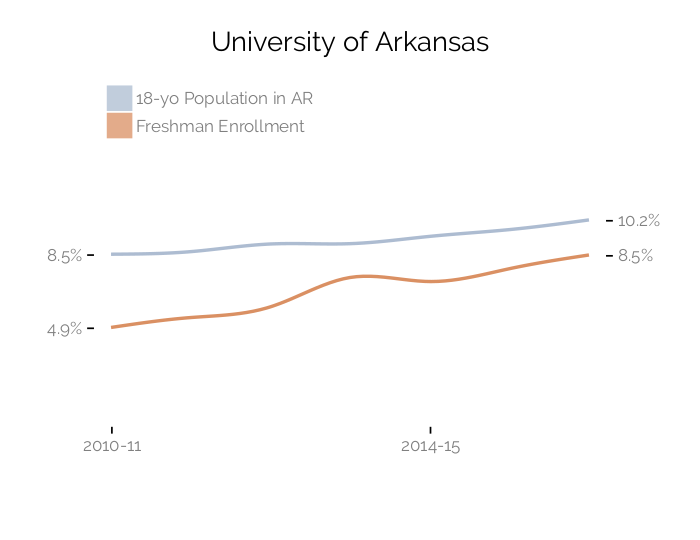
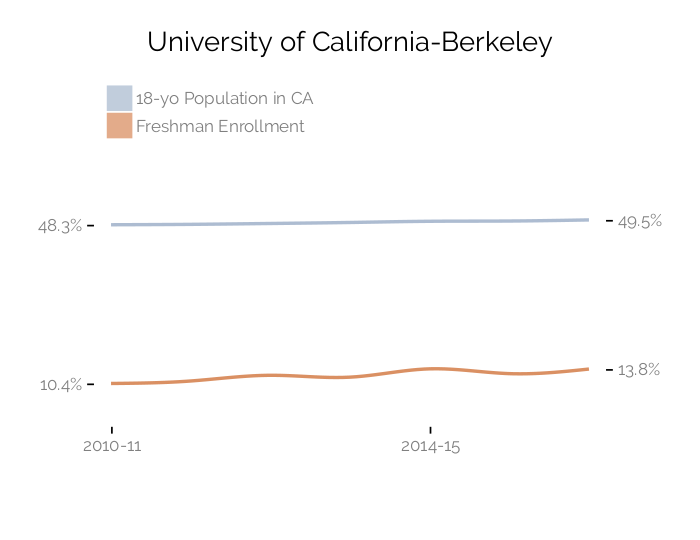
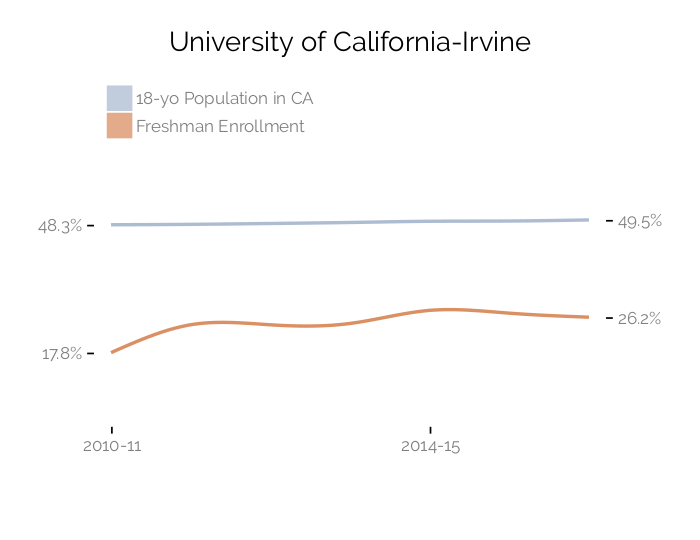
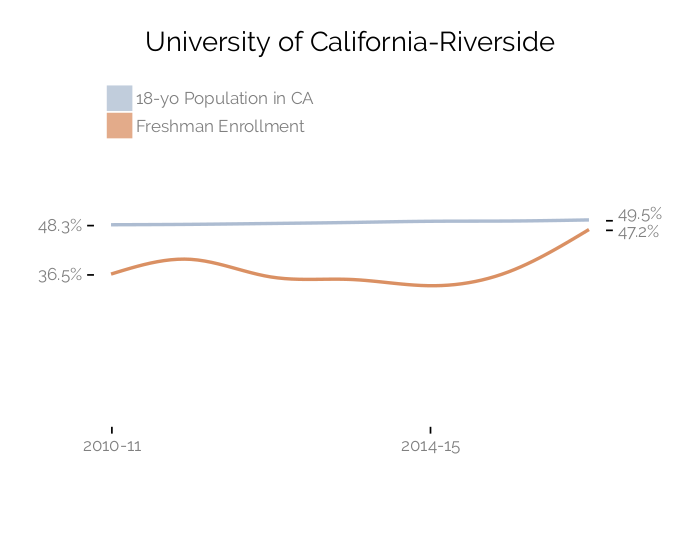
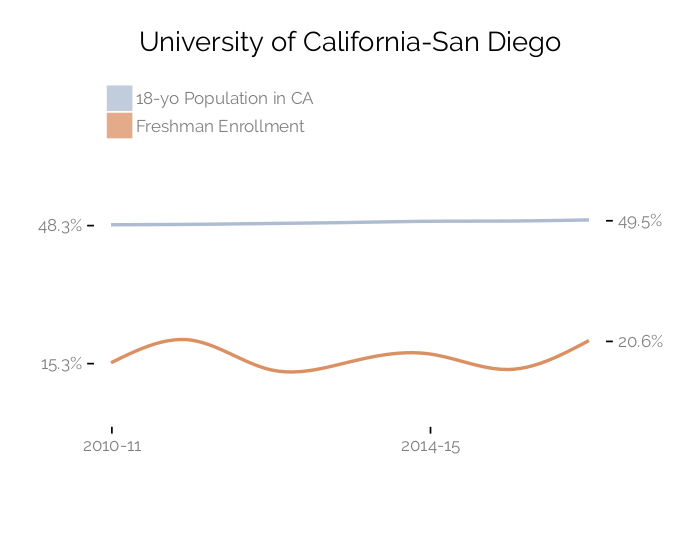
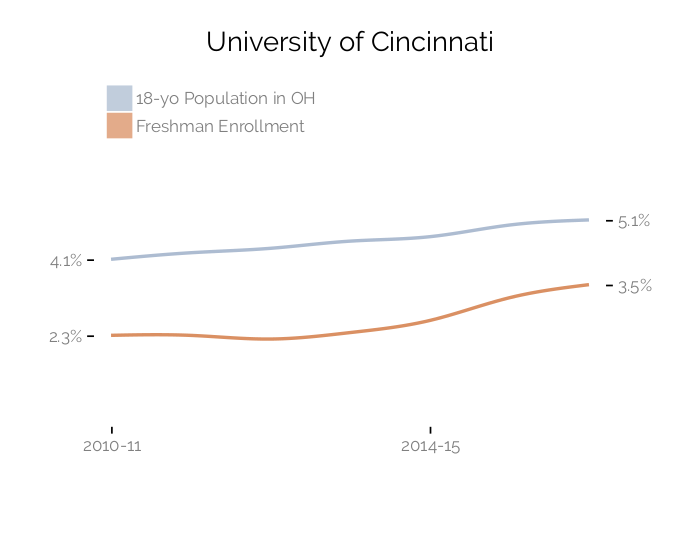
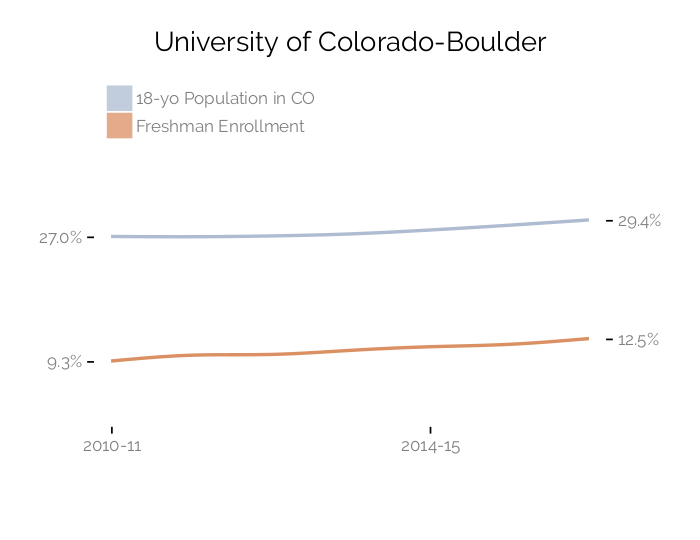
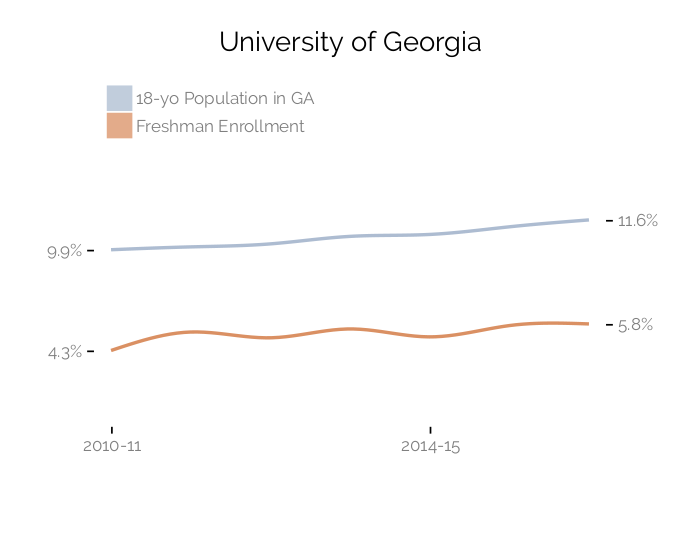
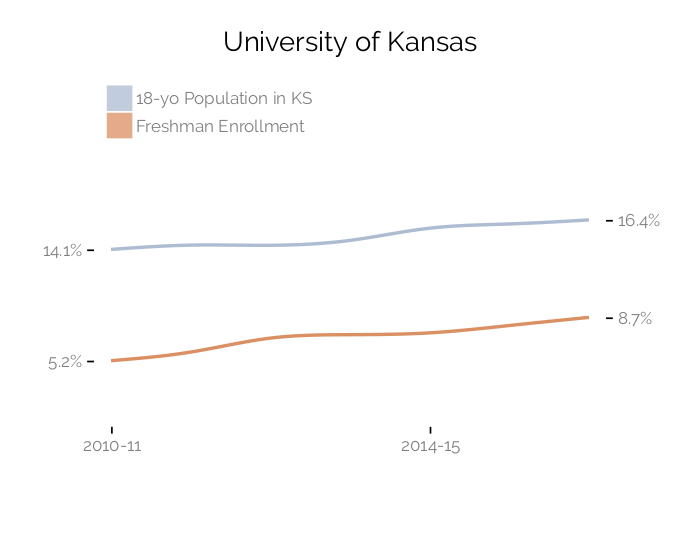
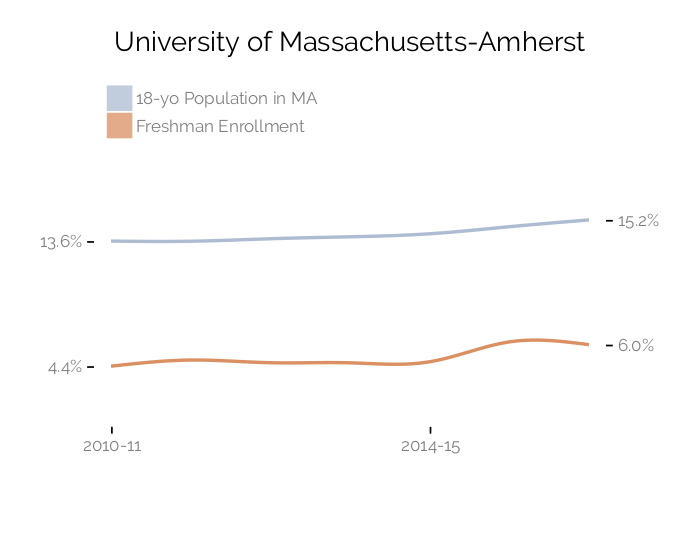
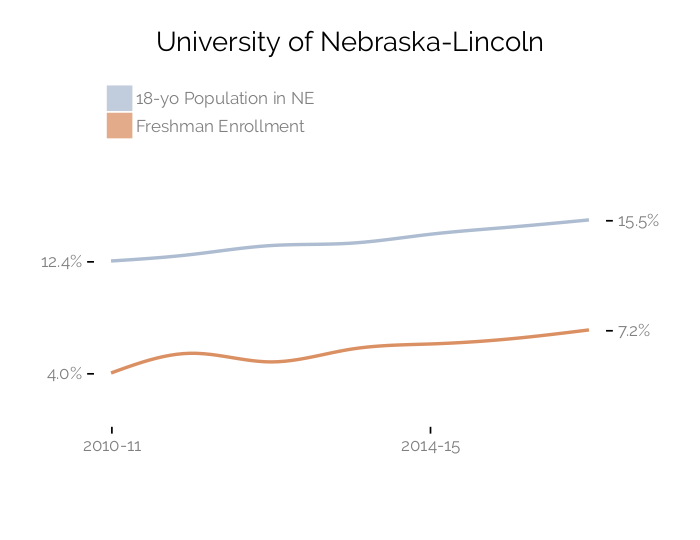
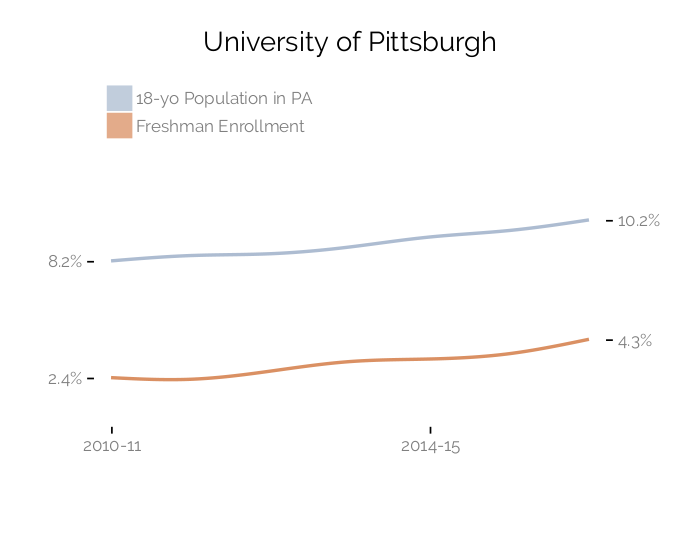
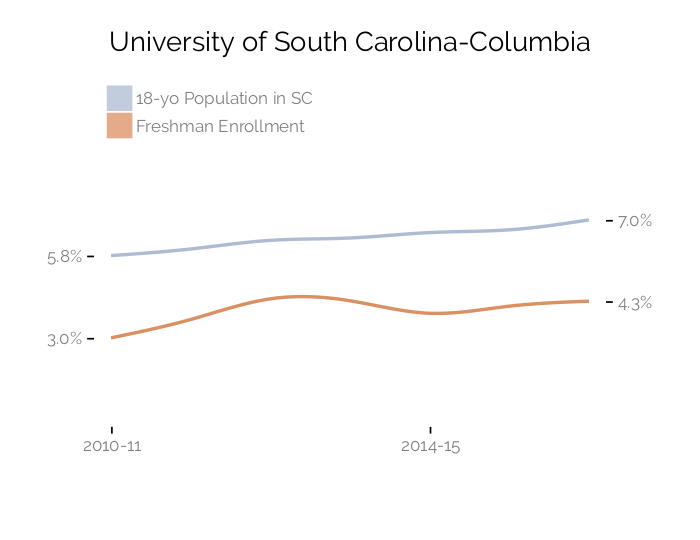
Percent Black 18-yo in State and Freshmen Enrollment, 2010-11 to 2016-17
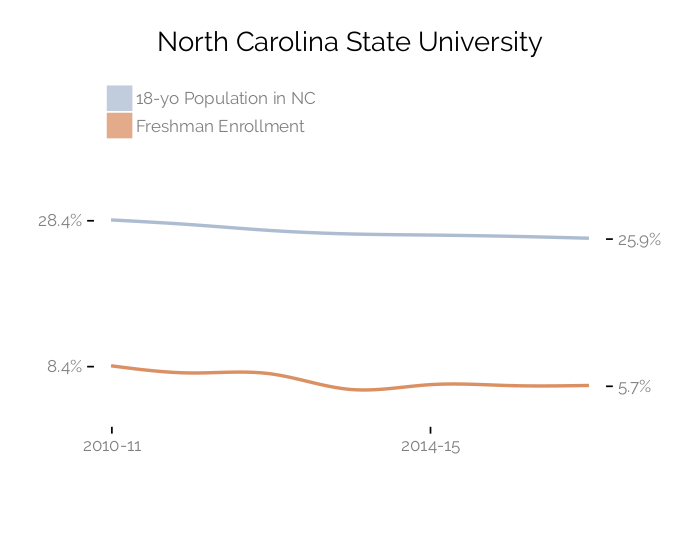
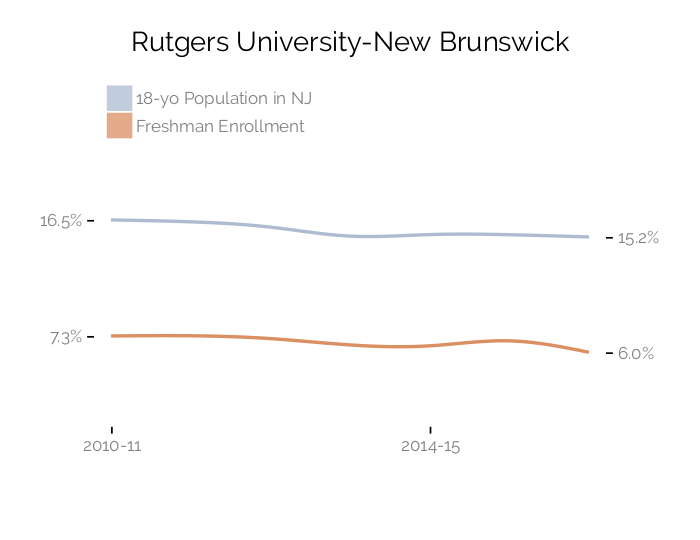
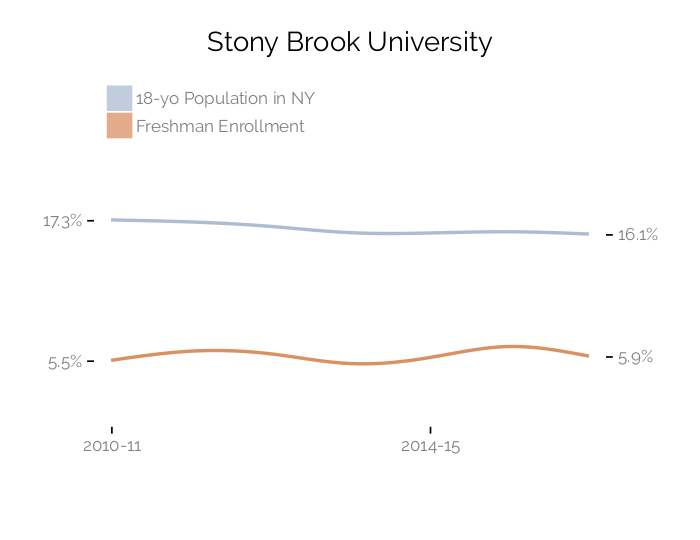
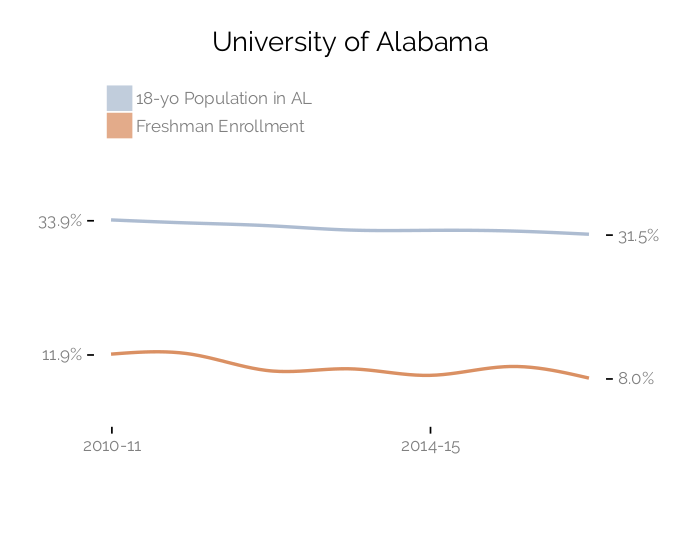
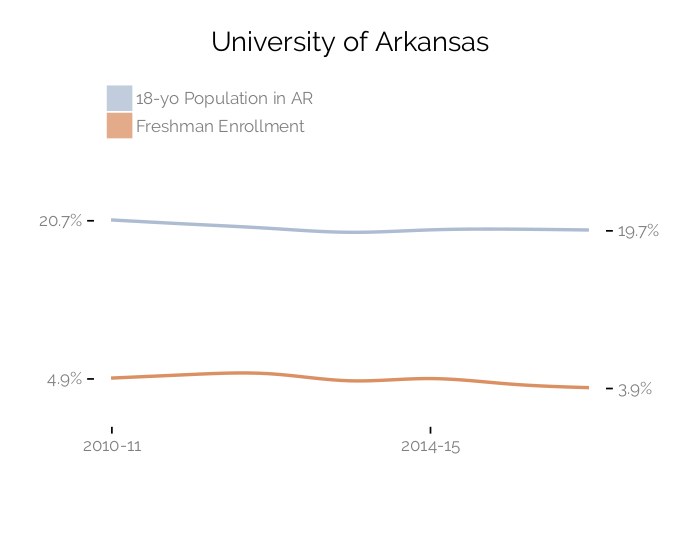
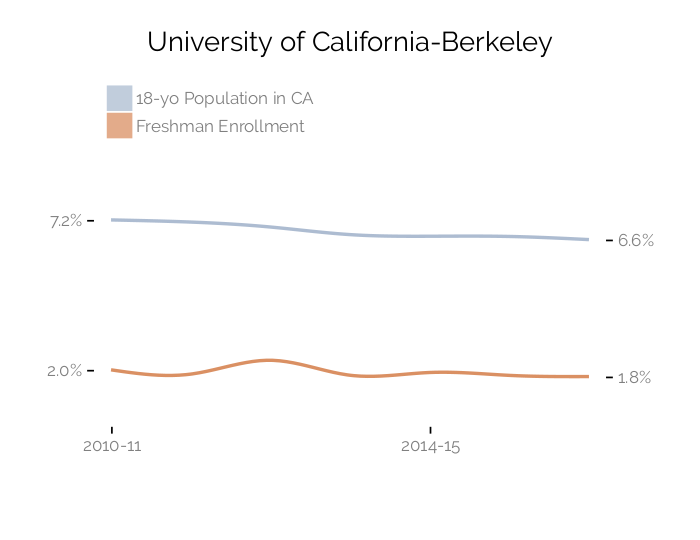
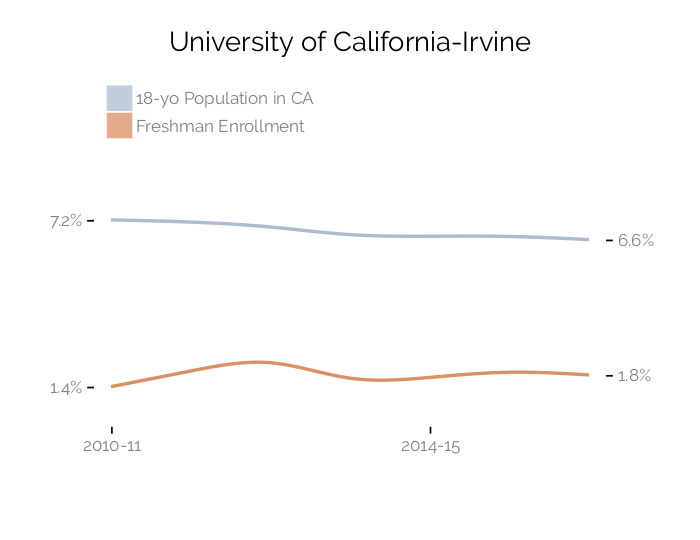
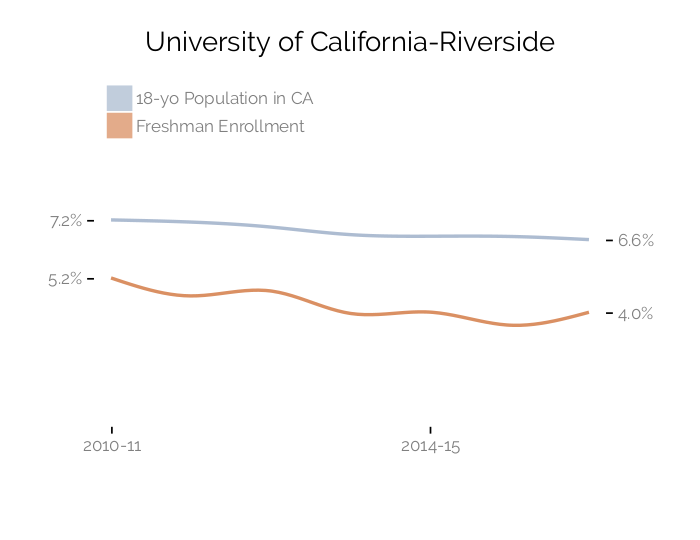
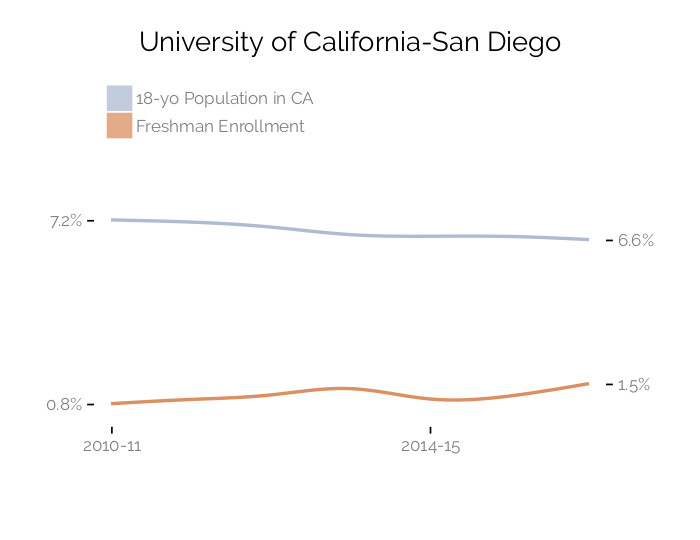
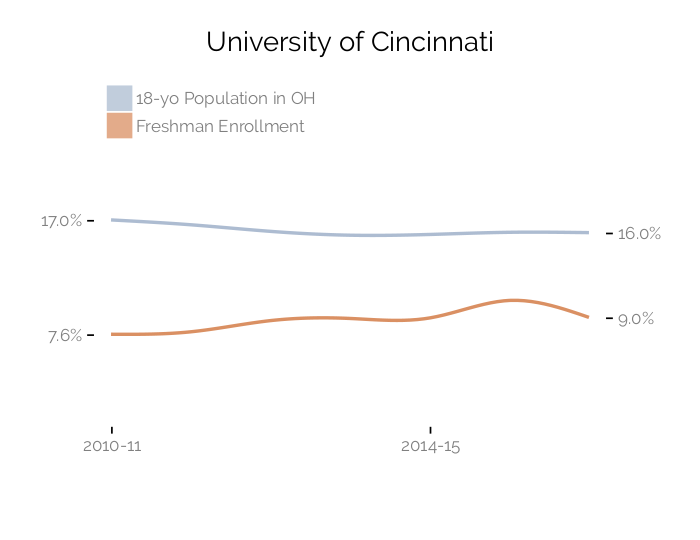
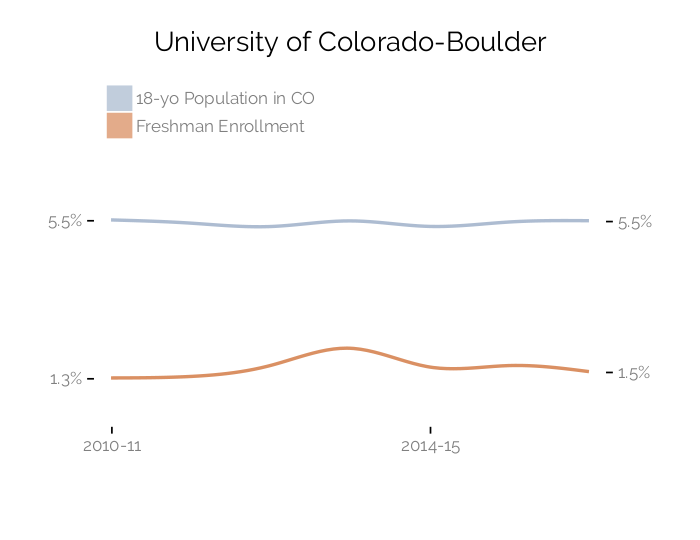
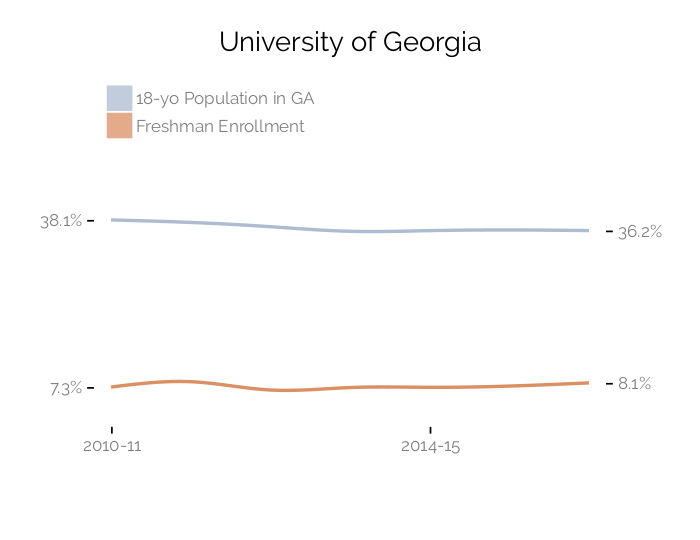
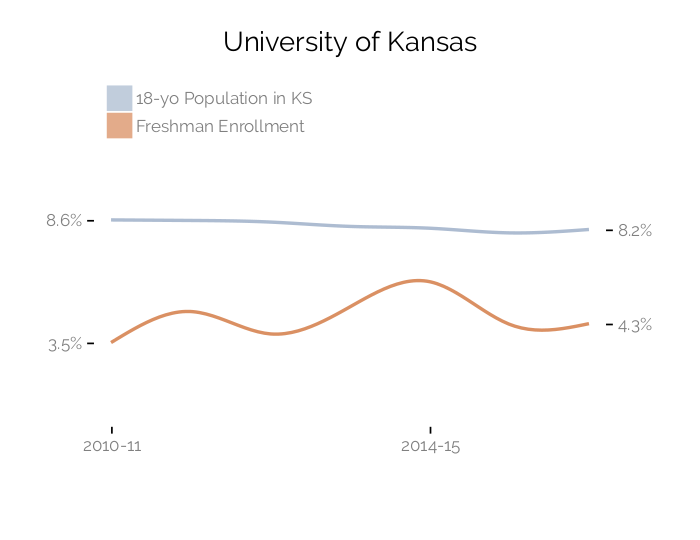
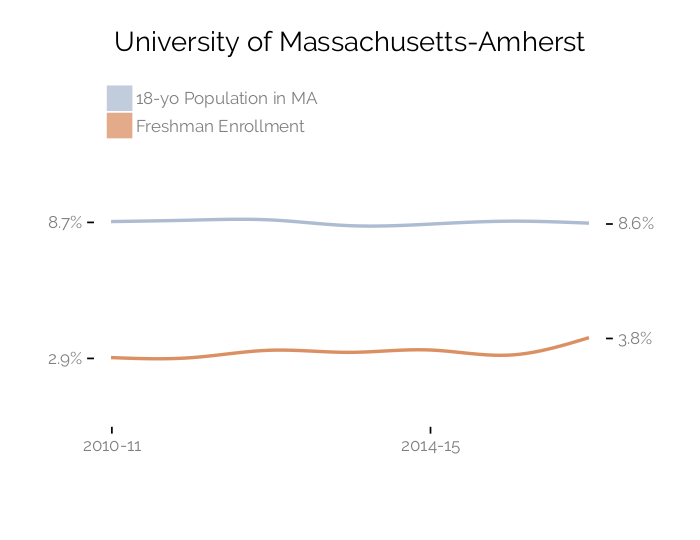
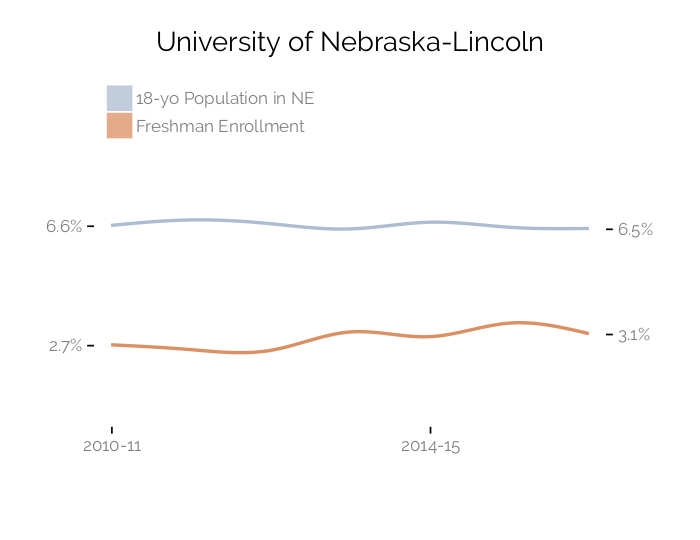
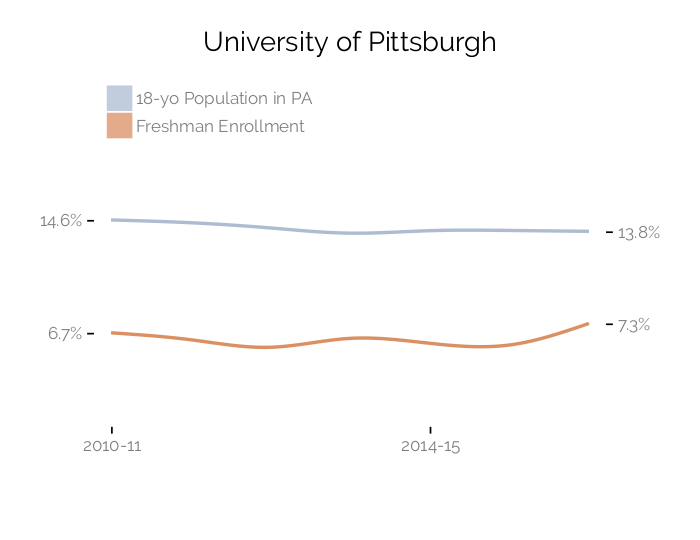
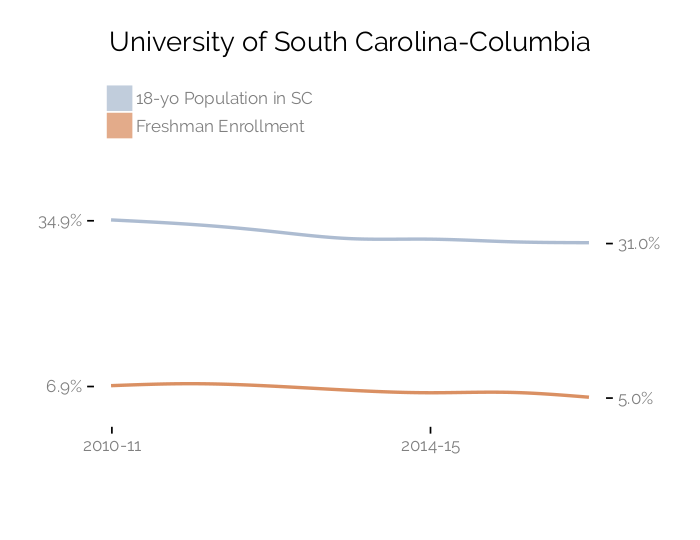
Note: Freshmen enrollment is defined as full-time and part-time first-time students. NIH race categories are defined by origin (Hispanic, Non-Hispanic) and race (White, Black, American Indian/Alaska Native, Asian/Pacific Islander), while IPEDS categories include White, Black, Hispanic, Asian, Native Hawaiian/Pacific Islander, American Indian/Alaska, two or more races, unknown races, and nonresident alien; We count all race categories in the total when calculating the percentage for each data source.
Appendix
Percent Latinx 18-yo in State and Freshmen Enrollment, 2010-11 to 2016-17
Note: Freshmen enrollment is defined as full-time and part-time first-time students. NIH race categories are defined by origin (Hispanic, Non-Hispanic) and race (White, Black, American Indian/Alaska Native, Asian/Pacific Islander), while IPEDS categories include White, Black, Hispanic, Asian, Native Hawaiian/Pacific Islander, American Indian/Alaska, two or more races, unknown races, and nonresident alien; We count all race categories in the total when calculating the percentage for each data source. We use Latinx as a gender-inclusive alternative to Latino or Latina. We also use Latinx in place of Hispanic within secondary data sources.
Appendix
Number of High School Graduates in State, 2000-01 to 2019-20
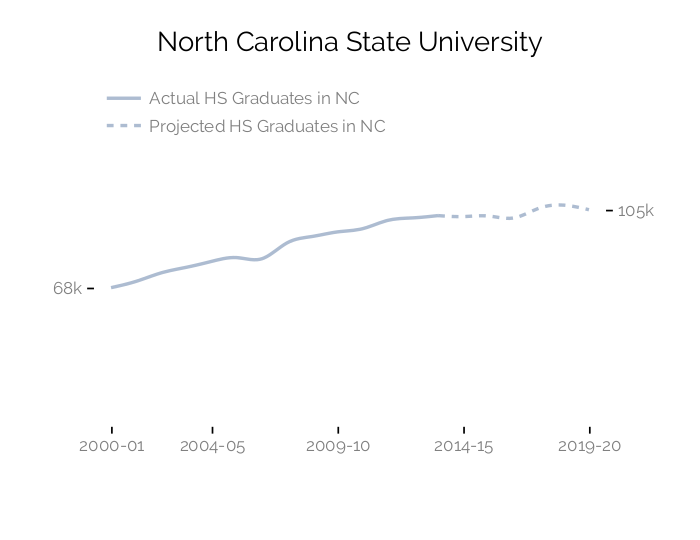
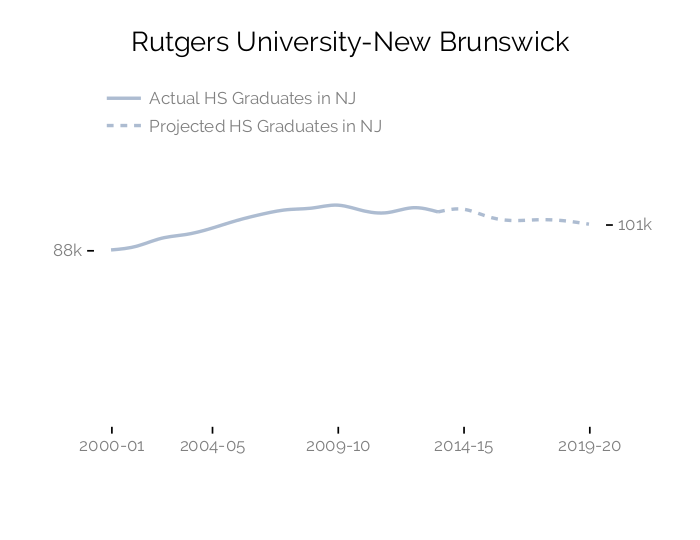
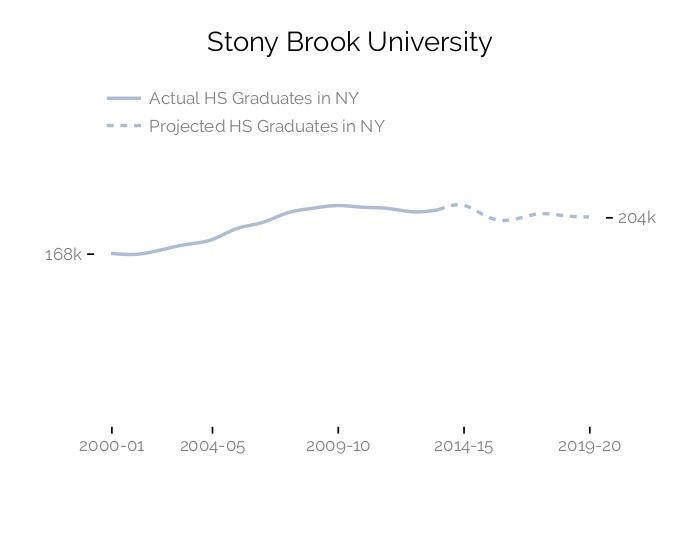
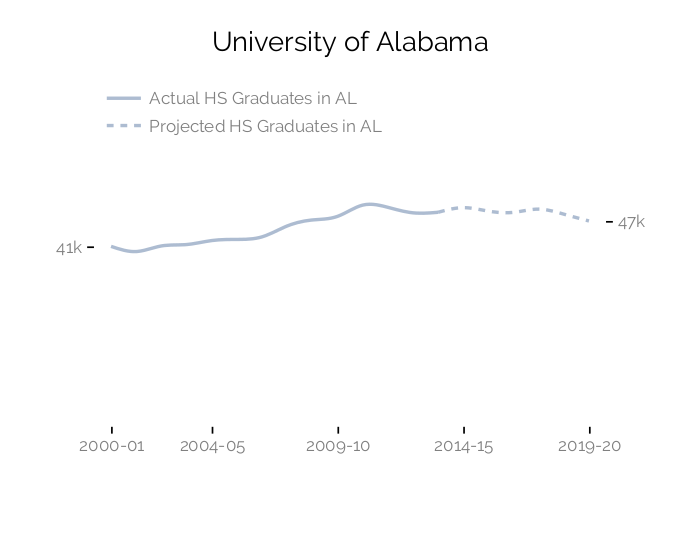
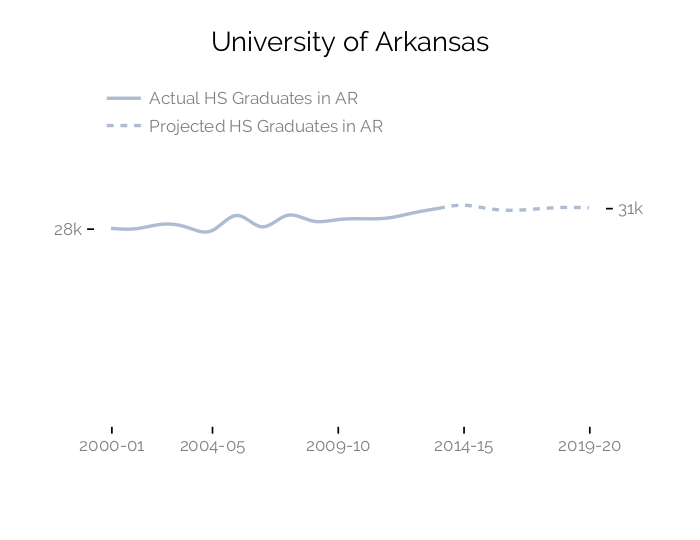
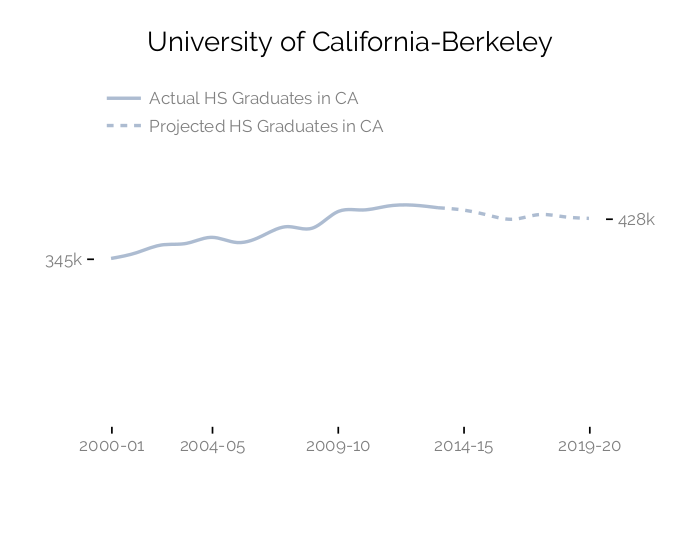
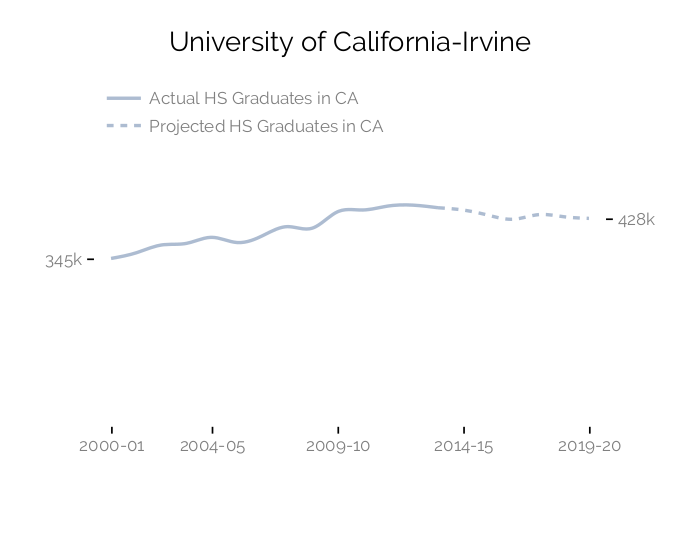
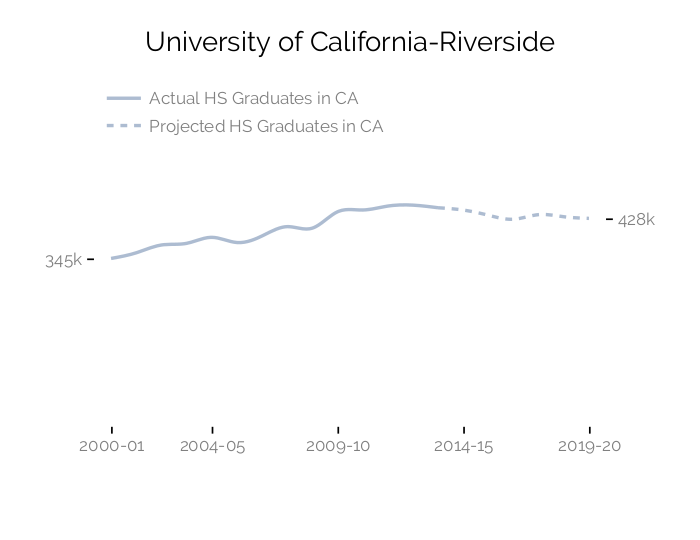
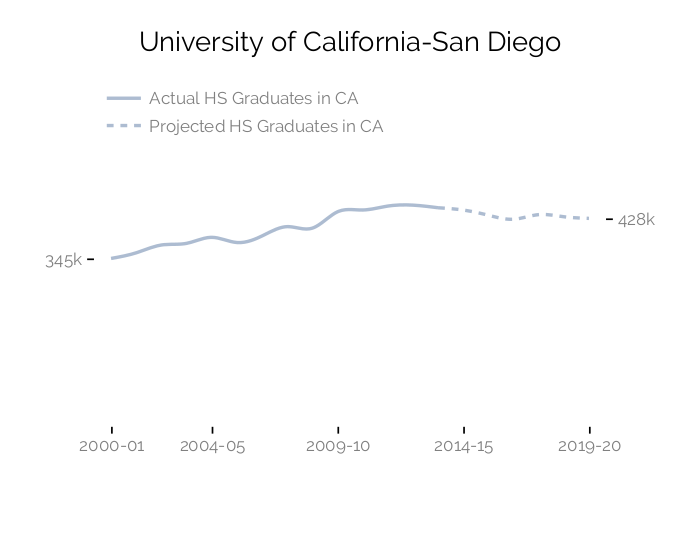
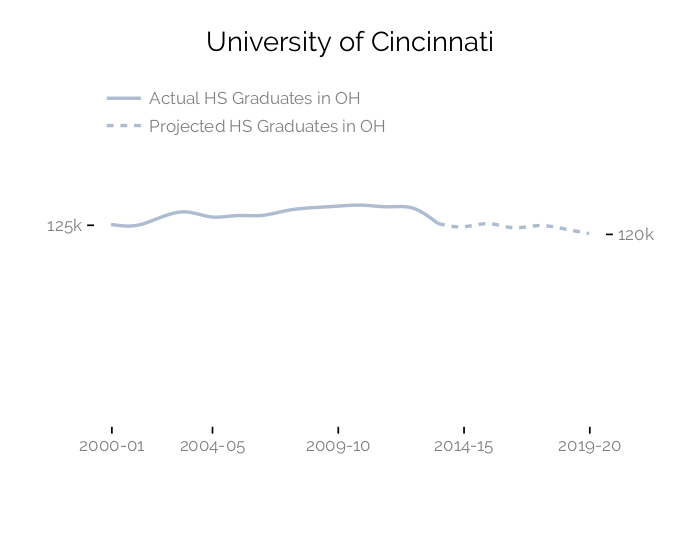
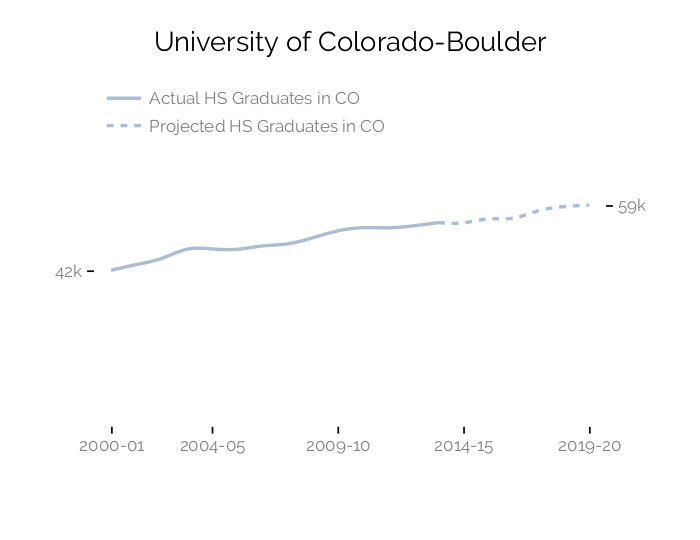
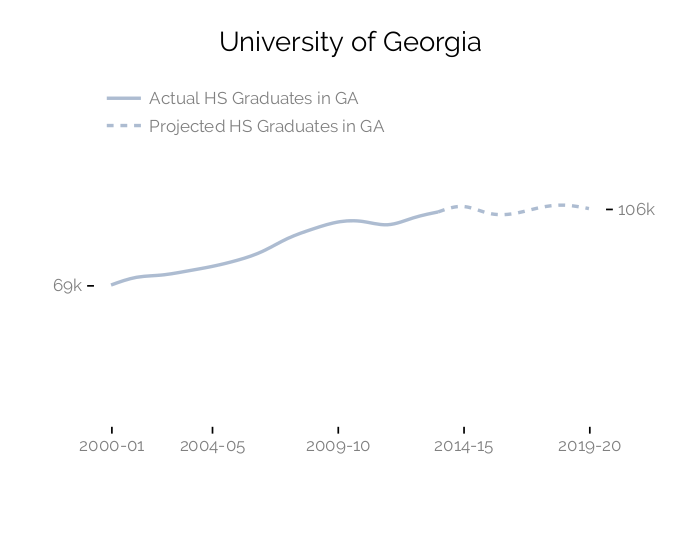
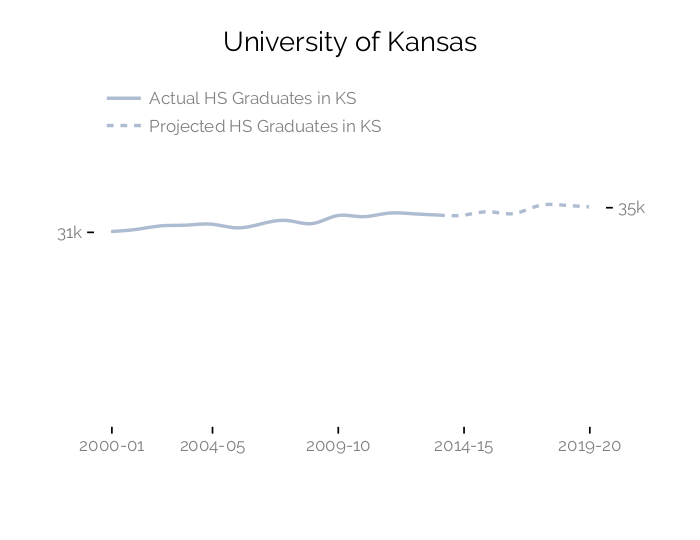
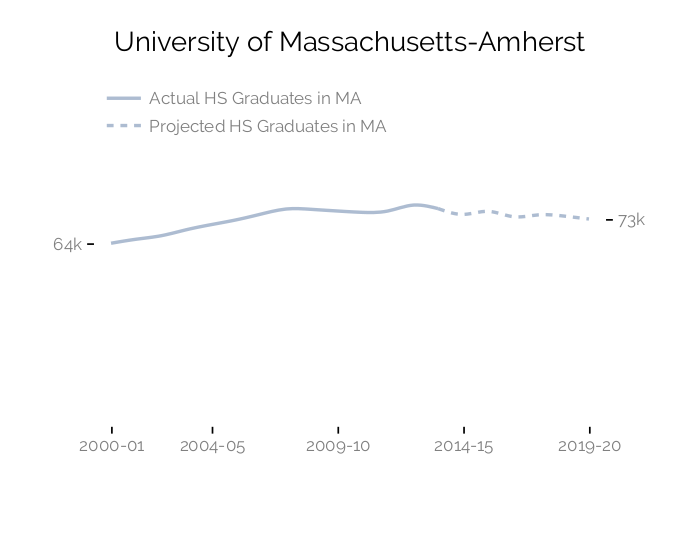
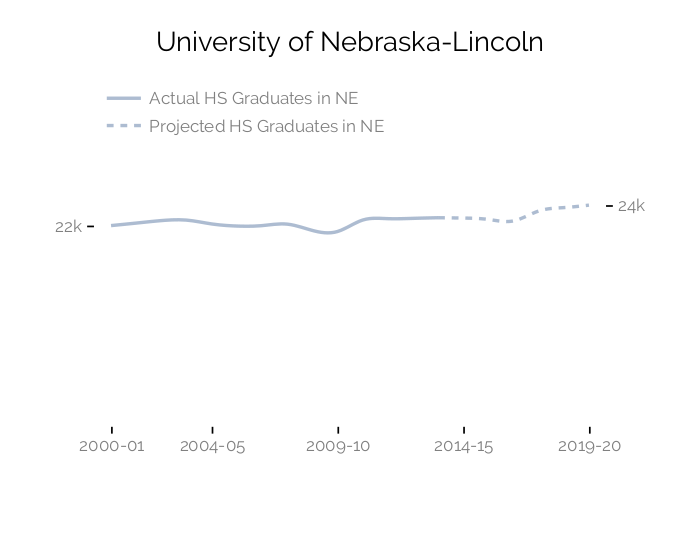
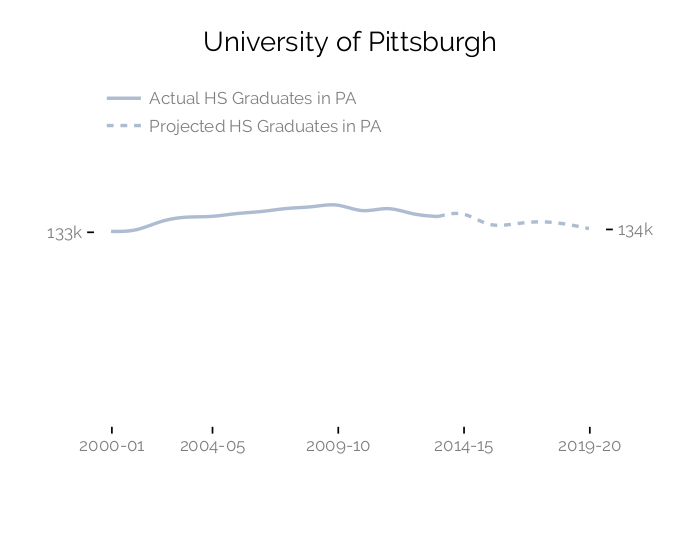
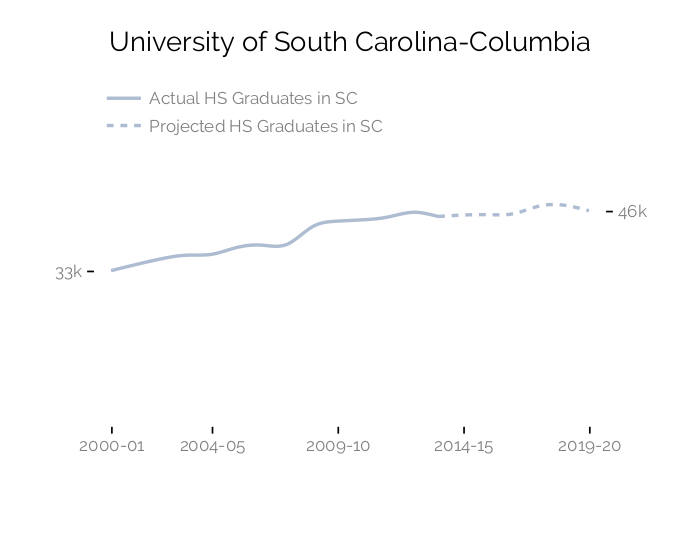
Note: High school graduates may include graduates from any point of each acacdemic year, from fall through the summer. Private high school data is only available on a biennial basis; Projected data for private high schools start from 2015-16 on and are produced based on data up to the 2010-11 academic year.